Understanding
Our Creations:
Using
Machine Learning to Understand Machine models.
CPM Working Paper 02-96 (May 2002)
David Hales
Centre for Policy Modelling,
The Business School
Manchester Metropolitan
University, Manchester, UK.
E-mail: dave@davidhales.com
Web: www.davidhales.com
Abstract
Artificial Society and
Artificial Life computer models often contain many exogenously defined
parameters. Such parameters may take a number of possible values. Alternative
values represent alternative model assumptions. The space of all possible
values comprises a parameter space of model variants. Results of
experimentation with such models are often based on execution of the model for
a fixed set of (arbitrary) parameter values. Given some (possibly) emergent
phenomena of interest, for which the model has been constructed to investigate,
such a method gives a simple “existence proof”. An existence proof demonstrates
that at least some parameter values are sufficient to produce the phenomena of
interest. However, a deeper understanding of the model can be achieved by
exploring the parameter space.
In this paper an
artificial society model (the StereoLab) is outlined which contains cooperating
interacting agents. Cooperation between agents is mediated by stereotypes that
are held by agents. The stereotypes evolve memetically via cultural interaction
and mutation. The model specifies a large number of exogenously defined
parameters that determine various aspects of agent and environmental behaviour.
Two methods of exploring this very large parameter space are applied in the
search for regions which produce high levels of agent cooperation. By using
these techniques a region is located in which a novel cooperation forming
process is identified based on the formation of agent groups.
1.
Introduction
Firstly, we introduce
the motivation for the StereoLab artificial society, then we outline the
computational implementation. Following this we discuss possible ways of
exploring the space of parameters specified in the implementation. We then
apply two methods of exploration in an attempt to locate regions in the space
which produce high levels of cooperation between agents. We outline the results
obtained by applying two methods discussed: random
sampling combined with decision tree induction and hill-climbing combined with cluster analysis. Finally we identify a
region in which a novel form of cooperation forming process (based on group
formation) is found.
1.1
When to Trust a Stranger?
In human societies people often have to interact cooperatively with others who they have never met before and therefore have no specific knowledge of. In those situations how does an individual select an appropriate behaviour? Specifically, in an economic transaction where trust is involved, when should a stranger be trusted? When should a stranger be cheated? Consider the following scenario:
“Imagine you are driving across country for a
family vacation when your car overheats. You have the car towed to a service
station that has a repair shop. The mechanic says you need an expensive new
radiator. It is a hot and humid August day, the kids are cranky, and you are in
no mood to pay to have your car towed to another shop for a second opinion. You
have no assurance that the mechanic is telling the truth or will charge a fair
price or do proper work. What should you do? Meanwhile, the mechanic is equally
worried that an out-of-town motorist may skip out on a bad check.” [13].
In this scenario both you and the mechanic will benefit if a fair deal can be struck. But how can either party trust the other not to cheat? What knowledge can you both draw on to make a decision? One mechanism for coping is to make use of “social cues”. Both you and the mechanic assess the situation, observe each other and draw on socially or individually gained knowledge to come to a decision on how to act. If a “similar” mechanic in the past did a poor job and overcharged then you might be tempted to write a bad cheque since “this guy looks like a cowboy mechanic”. Conversely, if the mechanic observes that you are wearing a caftan and have long hair he may conclude you are a “no-good hippie” who is simply not to be trusted. He may overcharge for poor work or worse may refuse to help you. The mechanic may have never met a “no good hippie” in person before. But those he socially interacts with have told him anecdotes of bad deeds. He has been told to watch out for people like this. The point is that individuals may judge others based on personal experience or socially learned beliefs. Also, socially learned beliefs may or may not have some relationship to some real experience, they could simply be myths of uncertain origin and veracity.
1.2
Social Cues and Stereotypes
Stereotypes are
defined here narrowly as knowledge that associates sets of attributes with sets
of individuals based purely on observable characteristics (social cues,
cultural markers or tags). It is assumed that stereotypes are constructed
maintained and evolved through social interactions between individuals over
time. It is also assumed that different individuals may posses different (even
conflicting) stereotypes and that the processes that generate them are due to
the need for cognitive efficiency and the selection of social strategies based
on very limited information. The social psychological literature refers to this
characterisation of stereotyping as the “information processing error”
explanation [15]. This is opposed to the “kernel of truth” position which
proposes that stereotypes are based (at least in part) on true group
differences embedded in the structure of society. However, it can be argued
that the “structural differences” from which stereotypes may be generated may
themselves be the result of processes involving stereotyping (among other
cognitive and social processes) and hence are reflexively[1]
related rather than simply reflectively related or false.
1.3
Social Cues and Social Distance
Social cues in the form of dress, accent, physical characteristics etc. may be used by individuals to make comparisons of “social distance” between themselves and others. It is well documented that individuals often prefer to associate with others who are similar to themselves [20]. Social cues therefore may often be used as mechanisms to enforce forms of social exclusion (either economically or culturally) by creating in-groups and out-groups from populations of individuals. Some social cues (or tags) may be easily changed via social influence (e.g. dress or accent) but others are hard to change or disguise (e.g. sex or racial characteristics). So, two kinds of cues may be delineated: fixed traits and culturally learned traits. Either or both of these kinds of cues may be used in processes of social distance estimation. Extreme examples of such practices manifest themselves in communities such as the American Amish [10]. But less extreme forms of social and economic exclusiveness permeate most societies, often involving sets of overlapping, emerging and dissolving groupings. Numerous social psychological studies [15], [12] find that individuals within groups are highly oriented towards their own group both in terms of actively harmonising their beliefs and behaving in a more altruistic way towards in-group members [11] and adapting stereotyped and negative attitudes towards out-group members (so called “in-group bias”).
1.4
Salient Features
From the above discussion and example scenario
some salient features may be outlined:
·
Individuals are highly boundedly rational social
and individual learners.
·
Individuals often need to interact with
strangers to achieve their goals.
·
Many interactions are only mutually satisfactory
if trust can be established.
·
Individuals may evaluate strangers with
reference to observable social cues.
·
The social cues an individual possesses may be
culturally learned and propagated.
·
Some cues may be fixed and unchangeable.
·
The way cues relate to selected behaviours may
be termed “stereotypes”.
·
Stereotypes can be socially learned and
propagated.
·
Individuals often prefer to interact with those
holding similar cues.
The StereoLab artificial society attempts to minimally capture these salient features. Agents playing pair-wise games of the one-shot Prisoner’s Dilemma (see section 1.5 below) model interaction involving trust. Social learning and the propagation of cues and stereotypes is modelled via a minimal “memetic” process. Exclusion practices based on cues are captured by the biasing of game and cultural interactions based on tags. Tags may be fixed or change via cultural interaction (details are given in section 2).
1.5
Modelling Trust as a Game
The Prisoner's Dilemma (PD) game models a common social dilemma in which two players interact by selecting one of two choices: Either to “cooperate” (C) or “defect” (D). From the four possible outcomes of the game, payoffs are distributed to the individuals. A reward payoff (R) and a punishment payoff (P) are given for mutual cooperation and mutual defection respectively. However, when individuals select different moves, differential payoffs of temptation (T) and sucker (S) are awarded to the defector and the cooperator respectively. Assuming that neither player can know in advance which move the other will make and wishes to maximise its own payoff, the dilemma is evident in the ranking of payoffs: T > R > P > S and the constraint that 2R > T + S. Although both players would prefer T, only one can attain it. No player wants S. No matter what the other player does, by selecting a D move a player ensures he gets either a better or equal payoff to his partner. In this sense a D move can't be bettered since playing D ensures that the defector can not be suckered.
The selection of a cooperative strategy by a player in the PD can be seen as a form of trust. The player exposes itself to exploitation by defection from the other player. Trust in this context represents some action that exposes the player to exploitation by another player when no binding agreement or contract is imposed. Trust, here, is seen as an interpretation placed on the action of an agent not a cognitive state of an agent. The StereoLab models economic interactions using pairwise singe-shot PD game interactions between agents (players).
1.6
Modelling Social Cues as Tags
Labels or tags are
defined as observable attributes attached to agents [2], [8], [17]. In a binary
string representation of a tag, each bit can be interpreted as representing the
presence or absence of some observable characteristic. The definition of tags
used by Holland [8] specifies that they are fixed and unchanging
intra-generationally but evolve inter-generationally.
The interpretation here, therefore, is one of physically observable properties
linked to genetic material. The role of tags as methods of increasing
cooperation in Iterated PD games has been discussed by Holland [7], [9] and
more recently Riolo [17] and Cohen et al. [4]. In these latter studies,
experimentation with computational models demonstrates empirically that tags
can increase cooperation in the iterated PD game.
However, tags have been used to represent cultural attributes which can be copied intra-generationally between agents in order to abstractly capture a form of cultural group formation [3], [5]. The interpretation in these cases is one of cultural characteristics gained through cultural interactions (e.g. style of dress, social demeanour etc.) which dynamically form identifiable cultural groups. Tags in the StereoLab may be both unchanging and fixed (the interpretation being of unchanging physical characteristics) or culturally learnable and mutable (the interpretation being of cultural traits such as style of dress).
2 The
StereoLab Artificial Society
The aim of the StereoLab design is to capture, in a highly abstracted form, the salient features outlined in section 1.4 above. Throughout the design of the society important assumptions have been parameterised.
Individuals are represented as simulated agents who display tags represented as binary bit strings (social cues). Agents encounter each other dyadically and play a single round of the PD game that may be thought of as an economic interaction requiring trust. Agents store a set of rules that map tag patterns to PD strategies (stereotypes). Figure 1 shows a schematic diagram of a StereoLab agent. Section 2.1 below describes the various components of the agent. Cultural interaction between agents also occurs dyadically and involves the propagation of tags and rules (treated as memes). Both game and cultural interaction are described in section 2.2 below. Agents inhabit a one-dimensional ring comprising a set of independent territories which may contain any number of agents including none (see figure 2).
2.1
Agents
Agents comprise a set of observable tags (bit strings), a set of behavioural rules and some state (memory) associated with each rule. The number of bits and rules stored are specified by exogenous parameters. Some proportion of the tag bits (specified by an exogenous parameter) and all rules are treated as memes. This means that they can be communicated and mutated. For each meme held the agent maintains a “confidence value” [0..1] which indicates how “psychologically attached” the agent is to the meme. Cultural interactions and periodic satisfaction tests affect confidence values. A proportion of the tag an agent holds may be fixed. The fixed bits never change. The proportion of fixed bits is specified by an exogenously defined parameter (BF). Figure 1 shows a schematic diagram of an agent. In the following sections the components of the agent are described.
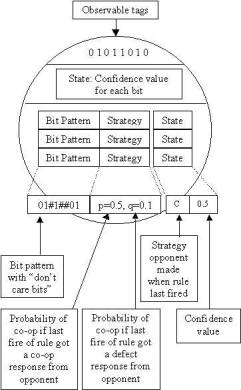
Figure
1
An agent in the StereoLab. An agent consists of a set of tag bits (observable by other agents) and a set of rules (stereotypes) mapping bit patterns to game strategies. Each tag and each rule has an associated confidence value.
2.1.1
Tags and Rules
In order to implement “stereotyping”, agents have the ability to generalise over observable tags using their behavioural rules. A simple form of pattern matching achieves this. Agents store some fixed number of rules that map patterns of observable tags to strategy representations:
<tag
pattern> => <strategy>
The tag pattern is a
string of the same length as the tag bit string but may comprise digits of zero
(0), one (1) and “don't care” (#). A “don't care” digit matches both zero and
one digits. This mechanism allows for generalisation. A tag pattern containing
all “don't care” (#) digits, would match all possible tags.
Since agents in certain circumstance may mutate the tag pattern this allows for generalisation and specialisation of stereotypes to take place. That is, rules may be widened or narrowed in their applicability. The number of rules an agent can hold is specified by an exogenously defined parameter (M). M is the same for all agents within a given society.
2.1.2
Strategies
Strategies are
represented as pairs (p,q) of real values in the range [0..1] as used in [17],
[14]. The (p) value represents the probability that the agent will cooperate
given that the opponent cooperated on
the last application of the rule. The (q) value represents the probability that
the agent will cooperate give that the opponent defected on the last application of the rule. Therefore for each
rule an agent has an associated memory storing either C or D which indicates
the move made by the opponent when the rule was last used. Initially these
memories are set randomly. The (p,q) strategy representation is stochastic with
a memory of one. It captures many variations of reciprocity and provocability:
(1,0) represents tit-for-tat-like reciprocity [2], (0,0) represents pure
defection and (1,1) represents pure cooperation. Consequently, though agents
actually play single round games, these are played by the agents as on-going
games of the Iterated Prisoner's Dilemma (IPD) as if all agents in the category
specified by the tag pattern in the rule were a single agent.
Given this arrangement
it is possible for an agent to play tit-for-tat against a whole group of other
agents as specified by the tag pattern associated with the strategy. This
captures the notion that an agent may punish an agent within a stereotyped
group for something which another agent from that same group did in the past.
We should note that intuitively it appears that such a process would make
cooperation very hard to achieve.
2.1.3 Mutation
Agents start with a
set of randomly generated memes (tags and rules). Any fixed tag bits are also
randomly initialised. Agents can only change their memes by mutation or by
accepting a meme from another agent via communication. After a satisfaction
test (see below) agents examine each of their memes to determine if mutation
should take place. The susceptibility of a rule to mutate is inversely
proportional to the associated “confidence” value. Since the LHS of a rule
(pattern label) is a bit string (perhaps including “don't care” symbols),
mutation takes the form of changing with probability MT (where MT is an
exogenously defined parameter) each digit from it's current value to one of the
other two values with equal probability. When a specific bit value (0 or 1) is
replaced by a “don't care” (#) digit then the rule is generalised. Conversely
when a “#” is replaced by a “0” or “1” the rule is specialised. On the RHS of
the rule, the (p,q) strategy representation, mutation takes the form of
changing, with probability MT, the values of each variable by some +ve or -ve
value in the range [-MS..+MS]. MS is an exogenously defined parameter. Final
values of p or q which are > 1 or < 0 are reset to 1 and 0 respectively.
After either mutation or communication changes a rule the confidence associated
with the rule is set to a random value. Here the notion of “cultural
innovation” is minimally captured. An agent will tend to mutate a rule
(stereotype) if its confidence in that rule is low.
2.1.4 Satisfaction Tests and Confidence Values
Confidence values are changed during cultural interaction and periodically through the application of an all-or-nothing satisfaction test. If an agent is satisfied then all of its confidence values are increased by some factor, otherwise all values are reduced by some factor. An agent is said to be “satisfied” if its average payoff from game interactions is above some threshold (T) since the last satisfaction test. An agent performs a satisfaction test with some probability (P) after each game interaction. Both T and P are exogenous parameters. Such a scheme implements a crude form of reinforcement learning: if an agent is satisfied it increases the confidence of all memes (by a factor of CI) otherwise confidence is reduced (by a factor of CR). Both CI and CR are exogenously defined parameters. Since the outcome of each game interaction results in an instant payoff it would not be difficult to accumulate payoffs against the rules that generated them. In this way, confidence values could be differentially updated. However, it is one of the assumptions of the StereoLab society that agents are highly bounded in their reasoning and that they don't know which individual memes are responsible for satisfactory outcomes [18].
2.2 Cultural and Game Interaction
There are two kinds of
independent interaction that occur between agents: game interaction where a round of PD is played (see section 2.2.3
below) and cultural interaction where
memes are exchanged (see section 2.2.2 below). The selection of partners for
both kinds of interaction may be spatially or tag biased.
2.2.1 Tag and Spatial Biasing of Interaction Partners
Both spatial and tag
biasing may be employed during the selection of partners for both game and
cultural interaction types. Tag biasing consists in rejecting a potential
interaction partner based on the number of differing bits between two tags -
tag distance. Exogenous bias parameters specify the extent of biasing for both
game (BG) and cultural (BC) interaction. They indicate the maximum tag distance
allowable before an interaction rejection is triggered. The total number of
rejections allowed in succession by a single agent before interaction is forced
is also specified as exogenously defined parameters (TG, TC).
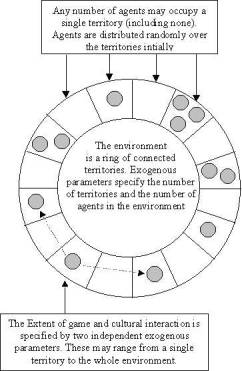
Figure
2
The
StereoLab interaction environment. Agents inhabit a ring of connected
territories. Each territory may contain any number of agents (including none).
An agent culturally and game interacts over some proportion of territories
specified by exogenously set parameters.
Agents also limit
their interactions to a subset of the population who are spatially close
(within their “interaction window”). The justification for this is that
cultural and economic interactions are often localised spatially within real
societies. Agents inhabit a one dimensional space (see figure 2). Each end of
the line is joined to form a ring topology. Along the line are a finite number
of locations or “territories”. The number of territories is specified by an
exogenous parameter (S). Each territory can hold any number of agents. Agents
are distributed along the line initially at random from a uniform distribution.
Both game (VG) and cultural interaction (VC) are mediated by independent
“interaction window” size parameters. The largest interaction window specifies
that agents in all territories are reachable from any other, the smallest
indicates that only agents within the same territory can interact. This spatial
arrangement allows for different cultural and game mixing methods to be
implemented. From pure random mixing (when VG and VC are at a maximum) to
highly restricted or niche mixing (when VG and VC are at a minimum). This
parameterisation allows for a large set of different localisation types to be
explored minimally in one dimension.
Both game and cultural
interaction is dyadic. Each kind of interaction is implemented separately: the
same pair of agents do not culturally and game interact at the same time. Selection
of a pair of agents for either kind of interaction follows the same pattern.
Firstly an agent is selected from the population at random, then an interaction
partner is selected at random from within the appropriate interaction window
(implementing the spatial bias). Then tag bits are compared and the interaction
partner is rejected if the tag bias constraint is not met. If interaction was
rejected another interaction partner is selected. This re-selection is
continued until an appropriate interaction partner is found, or until the
maximum number of rejections is reached after which interaction is forced with
the next randomly chosen partner.
2.2.2 Cultural
Interaction
Each rule and
(non-fixed) tag bit held by an agent is viewed as a meme. The tag bits can be
considered as “surface memes” or “social cues” visible to other agents. The
rules can be considered as “hidden memes” which are not visible to others. Both
are communicated (i.e. propagated from agent to agent) in the same manner.
Two agents are
selected for cultural interaction using the selection method described
previously (see section 2.2.1 above). Given two agents have been selected, one
becomes the sender, the other the receiver (decided by a fair coin toss). Each
meme held by the sender is proposed to the receiver with a probability of PM
(this is an exogenous parameter, 0 indicates no meme propagation, 1 indicates
all memes are proposed). The fundamental mechanisms of meme spread are those
of:
·
Replication: the sender replicates a meme to the
receiver overwriting an existing meme.
·
Reinforcement: the receiver already possesses
the meme proposed by the sender and this results in an increase in confidence
associated with that meme by the receiver.
·
Repelling: the receiver is likely to reject an
attempted replication when the associated confidence value of the meme to be
overwritten is high.
In order to implement such mechanisms each
agent must possess the ability to classify its memes into one of three types
with respect to the proposed meme: a)
Identical memes - which can be reinforced; b) Contradictory memes - which need
to be removed if the new meme is accepted; c) Other memes - which are neither
identical nor contradictory. The tag bits are naturally either identical or
contradictory (the bits match or they do not). Rules (stereotypes) are deemed
to be identical if both the pattern and the strategy match exactly and
contradictory if the patterns match exactly but the strategies don't. In this
latter situation the rules are considered contradictory because they would both
fire for an identical set of opponents but give different strategies to apply.
The process of meme propagation involves the steps shown in figure 3.
2.2.3 Game
Interaction
Game interaction involves the pairing of two
agents for a game of the one-shot PD. Two agents are selected for game
interaction with relevant tag and spatial biasing mechanisms as previously
described (see section 2.2.1 above). Each agent decides whether to cooperate or
defect in the following way (figure 4 summarises the below process):
·
Each
agent reads the others tag string.
·
Using
this tag each agent searches its set of rules.
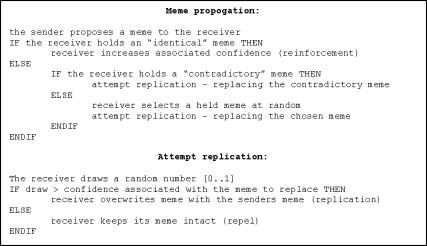
Figure 3
The steps involved in the
propagation of a meme from one agent to another. During cultural interaction
between two agents the sender propagates each of its memes with PM probability.
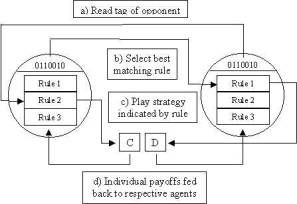
Figure 4
Game interaction in the
StereoLab. Game interactions take place between selected pairs of agents. Each
agent reads the others tag bits and fires a matching rule producing a
particular game move (C or D).
·
Each
rule with a LHS tag pattern that matches the tag is marked as “active”.
·
Each
“active” rule is assigned a score based on the number of actual bits (1 or 0)
that match (specific rules are therefore scored higher than general rules).
·
The
rule with the highest score is “fired” and the appropriate action performed as
dictated by both the strategy represented on the RHS of the rule and the
associated memory.
·
If
more than one rule has the same highest score (i.e. there is a tie) then the
rule with the highest confidence is used. If more than one rule has the same
highest confidence then a random selection is made between them. There will
always be at least one “active” rule since each agent is forced to maintain a
default rule - that being, all “don't care” states on the LHS.
2.2.4 Rule Consistency &
Redundancy
A cultural interaction event is defined such
that it cannot result in either contradiction or redundancy within an agent
rule set. This does not mean that more than one rule from the rule set of an
agent cannot match the tag pattern of a single agent. This is resolved via
specificity, then confidence, then ultimately a random choice. “Contradictory”
and “identical” rules are not allowed to coexist within a single agent rule
set. The LHS of each rule must be unique. If a mutation event causes two LHS'
to become identical it is reversed.
2.3 The Time Unit Cycle
In
a given time unit the following events occur:
·
With
probability FG two agents game interact.
·
With
probability FC two agents culturally interact.
·
With
probability FM one agent moves spatially.
Movement involves a randomly selected agent
moving to a randomly selected location. A single cycle of the system is defined
as the number of time units required until 10N game interactions have occurred,
where N is the number of agents in the society (an exogenously defined
parameter). FG, FC, FM and N are exogenously defined parameters.
2.4 Summary of
the Parameters
A summary of the exogenous parameters used by
the StereoLab is given in table 1 below. The range column indicates the range
from which values can be selected. Parameters with a single value in the range
column indicate that they were fixed at the stated value for the work presented
here. The satisfaction threshold T, the probability of a satisfaction test P
and the Prisoner's Dilemma payoffs PT, PR, PP and PS are all fixed. The fixing
of PD the payoffs means game interactions follow the constraints for the PD.
Note that the satisfaction threshold T and
the probability of satisfaction testing P are fixed such that a game
interaction only produces satisfaction if an agent receives a temptation (PT)
or reward (PR) payoff (see section 2.5 below for a justification of this). The
reasons for the odd fixed values for the number of agents (N) and the size of
the environment (S) are discussed in section 4.1. Several of the parameters
were fixed or limited in range for practical reasons. For example, N and S are
fixed since large numbers of agents would significantly increase the time taken
to execute a simulation run and very sparse distributions of agents in the
environment (which would result from large values of S or small values of N)
would limit the application of spatial biasing. Large values for B (the number
of tag bits) also significantly increases execution time and small values
(below two) would not allow for the proper functioning of the tag processes
previously described. The minimum value for FG is set to 0.1 rather than zero
since some level of game interaction is required in order to obtain meaningful
results.
|
Name |
Description |
Range |
|
B |
Number of bits in tag string |
4..8 |
|
M |
Number of stereotypes an agent can store (memory size) |
2..10 |
|
S |
Number of locations in environment |
101 |
|
N |
Number of agents in the society |
101 |
|
T |
Satisfaction threshold |
3 |
|
PM |
Probability of meme propagation |
0..1 |
|
P |
Probability of satisfaction test |
1 |
|
MT |
Mutation rate |
0..1 |
|
CI |
Factor by which to increase confidence |
0..1 |
|
CR |
Factor by which to decrease confidence |
0..1 |
|
MS |
Mutation size for strategy parts |
0..1 |
|
FG |
Probability of game interaction over a time unit |
0..1 |
|
FC |
Probability of cultural interaction over a time unit |
0..1 |
|
FM |
Probability of random agent movement over a time unit |
0..1 |
|
BF |
Proportion of tag bits that are fixed |
0..1 |
|
BG |
Prop. of tag bits that must be shared to avert game interaction
refusal |
0..1 |
|
BC |
Prop. of tag bits that must be shared to avert cultural interaction
refusal |
0..1 |
|
TG |
Number of refusals allowed before forced game interaction |
1..10 |
|
TC |
Number of refusals allowed before forced cultural interaction |
1..10 |
|
VC |
Proportion of locations which form cultural interaction window |
0..1 |
|
VG |
Proportion of locations which form game interaction window |
0..1 |
|
PP |
The Punishment payoff from the PD matrix |
1 |
|
PT |
The Temptation payoff from the PD matrix |
5 |
|
PR |
The Reward payoff from the PD matrix |
3 |
|
PS |
The Sucker payoff from the PD matrix |
0 |
Table 1
The parameters which
characterise the StereoLab artificial society
2.5 What Kind of Society Has
Been Proposed?
A moments reflection on the fixed parameters
and the nature of the agents indicates that since the agents are satisficers
rather than optimisers, and since the satisfaction threshold T = PR (the reward
payoff from a PD interaction), the dilemma of the PD is partially resolved.
That is, if all agents choose to cooperate then all will be satisfied. The
assumption expressed here is that for all StereoLab societies a state of total satisfaction through
complete cooperation is possible. To put this in more anthropomorphic way:
each agent is happy to sustain a convention of cooperation if all other game
interaction partners encountered also cooperate. This assumption intuitively
makes cooperation appear more likely. However, this can be contrasted with the
previous assumption that agents may retaliate against others that are
categorised within the same stereotype as a previous agent that was not
cooperative - they make a generalisation. This generalisation means that agents
subjectively stereotyped as members of the same group are treated as if they
were a single individual. Taking both of these aspects into account the
StereoLab consists of agents who (quite reasonably) are prepared to cooperate
if all others do so but (perhaps less reasonably) may retaliate against any
stereotyped group member when some member of that group does not cooperate.
Such agent behaviour is very reasonable if the stereotyped groups are viewed as
single agents rather than some subjectively categorised grouping.
3. Exploring a Parameter
Space
In order to explore a large parameter space,
firstly, some method of sampling the space is required and secondly, some
method of interpreting the sample in a meaningful way is required. In this
section several methods of sampling and interpreting (in the form of locating
regions with common properties) are discussed.
3.1 Methods of Sampling a
Parameter Space
3.1.1 Systematic Sweep
One method of sampling a parameter space
involves a scan or sweep of a range of parameter values in some systematic way
[1], [4]. Such a technique may be visualised as the imposition of a grid or
lattice structure over the parameter space with each line intersection
representing a single simulation run (see figure 5).
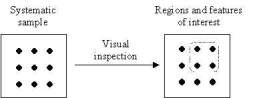
Figure 5
Systematic (or sweep scan)
sampling of the parameter space and visual inspection is often used for low
dimensional spaces.
However for a large parameter space with many
dimensions a meaningful systematic scan may not be possible within a feasible
time (for example, if it is not possible to scan at least two values from each
parameter). An alternative in such cases is to randomly select points within
the space up to available computational resources.
3.1.2 Random Sampling
Random sampling involves selecting parameter
values at random (from a uniform distribution) over their ranges. In this way
all points have an equal chance of being selected. Given a random sample it is
possible to estimate statistical characteristics of the space. In this way the
entire space can be characterised (in a statistical sense).
3.1.3
Heuristic Search
A more intelligent form of sampling the space
may be employed. It is possible to utilise a heuristic search if it is known in
advance what kinds of points in the space are desirable or interesting. For
example, the simple local search method of “hill-climbing” may be employed if
points of interest can be reached by maximising some observable measure from
the simulation. Hill-climbing involves starting at some random point in the
parameter space and then sampling neighbouring points until some higher value
for the measure is found. If such a point is found then this becomes the new
starting point for further sampling. The process is iterated until no further
movement is possible or some computational limit is reached. Essentially then, hill-climbing
attempts to ascend gradients in the space and it will work well in a space with
long smooth gradients such that random points in the space can be easily
climbed, leading to global maxima. A space with many local maxima would be less
amenable to simple hill-climbing.
The use of a hill-climbing search therefore
makes assumptions about the nature of the space that may or may not be valid.
In general the best way to test the assumptions is to actually run
hill-climbing and determine if the results are satisfactory.
3. 2
Characterising Regions in the Space
Given some sample of points from a high
dimensional space (either randomly, systematically or intelligently gathered),
the problem remains of to how the points can be interpreted such that the
results can be presented in a meaningful form - relating the values of
exogenous parameters to observed behaviours. For a low dimensional space with
one or two dimensions, a visual method of presentation and inspection is often
sufficient for this purpose. For a high dimensional space however, this option
is not possible.
One approach to aid interpretation is to
locate regions within the space that bound points with similar properties. If
some subset of points in a sample can be categorised as having a given property
of interest then methods can be applied which attempt to find homogenous
regions of such points that are spatially close.
One method of specifying a region within a
parameter space is to enumerate a set of intervals, one interval for each
parameter. Such a region is therefore a cuboid with dimensions equal to the
number of parameters and a volume equal to the product of all the interval
sizes. The task of identifying regions bounding points with a given property of
interest can be constructed as a process of recursive splitting of the
parameter space until regions are found that bound points which all have the
property. This is essentially the task performed by a class of decision tree
induction algorithms developed within the Machine Learning community (see
section 3.2.1 below).
Another method of locating regions with high
concentrations of points with a property of interest is to use some form of
cluster analysis over only those points from a sample which have the property.
The result of a cluster analysis is not a set of strictly bounded regions (as
produced by decision tree induction methods) but an assignment of each point to
a particular cluster (see section 3.2.2 below).
3.2.1 The C4.5
Classification Algorithm
The C4.5 classification algorithm [16]
induces decision trees from a sample over a space of parameters (attributes)
for a given categorical variable (in this case some category of observable
phenomena of the simulation runs). The algorithm works by recursively splitting
the parameter space along the dimension which produces the highest “information
gain” (based on information theory) over the sample. This process continues
until a region is homogenous (based on the categorical variable) or some
minimum size (based on the number of points in the sample which fall within a
region) is reached. In the latter stopping condition, regions may be found
which are not homogenous if the minimum size (or weight in C4.5 terminology) is
more than 1. In order to apply C4.5 to a sample of the space it is necessary to
categorise each point in the sample. For a one dimensional output value,
thresholding can be used giving a set of classes over the output. Figure 6
shows schematically the application of C4.5 to a random sample producing class
homogenous regions.
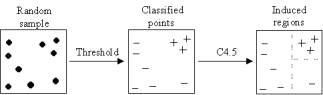
Figure 6
Points sampled randomly from
the parameter space can (if categorised) be processed by the C4.5 algorithm to
induce a set of category homogenous regions in the space.
3.2.2 Cluster
Analysis
Cluster analysis techniques partition a set
of points into some number of clusters. In the analysis which follows (see
section 4.2 below) k-means clustering was used [19]. This technique uses a
heuristic search to minimise an objective function (this being a simple form of
hill-climbing). The search space consists of all possible allocations of points
from the sample between some specified number of clusters. Searching the space
involves the movement of points between clusters to minimise the objective
function. The objective function is based on the sum of the mean distances of
all points from their cluster centroids. Various distance metrics may be
employed (in the work presented here simple Euclidean distance is used), and
obviously, data has to be sensibly normalised for the given metric. It should
be noted that the k-means algorithm requires that the number of clusters is
specified a priori and does not
guarantee to find the global minimum. Since this is the case it is considered
prudent to run the search several times with different initial starting
conditions (initial centroid values). Also since an a priori choice for the number of clusters needs to be made it is
also often considered useful to run k-means with a range of cluster numbers and
make a choice based on the final value of the objective function found for each
clustering [19]. In the analysis which follows (section 4.2) hill-climbing was
used to find points of maximum cooperation in the StereoLab parameter space
(see section 2.4 above). These points were then analysed using k-means cluster
analysis. Figure 7 illustrates this process schematically.
4 Searching
for Cooperation in the StereoLab
We wish to find regions in the StereoLab
parameter space where cooperation is high. The parameter space was quantised
into discrete increments. For integer parameters the increment was set to 1.
For parameters in the range [0..1] the increment was set to
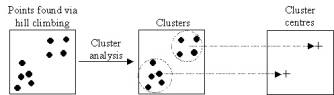
Figure 7
Cluster analysis applied to
a sample of points found via hill-climbing may be used to find cluster
centriods.
0.1. This produces a discrete space, or grid,
containing 5 x 9 x 103 x 1112 = 1.41 x 10¹⁷
possible unique points. In order to locate regions of high cooperation two
methods were used. Firstly, decision tree
induction was used over a large random sample of points taken from the
whole space (section 4.1). Secondly, k-means
cluster analysis was used with points found via hill-climbing in the space
(see section 4.2).
4.1 Results - Random
Sampling and Decision Tree Induction
The C4.5 decision tree induction algorithm
was used to induce regions in the space as follows: Firstly the parameter space
was randomly sampled (approximately 10,000 points) in order to gain an
empirical measure for the prevalence of cooperation within the space. Each
point in the space represents a simulation run terminated after 100 cycles. As
stated previously, (section 2.3 above) one cycle is equivalent to 10N game
interactions (where N is the number of agents). The number of agents is fixed
at 101[2]
for all experiments detailed here. Consequently a single simulation run is
terminated after 101,000 game interactions. This means the sample is a
synthesis of approximately 1.01 x 10⁹ individual game interactions.
Game interaction between agents involves
pairs of agents playing single-round games of the PD. The amount of cooperation
(CC) for a run is calculated as the proportion of mutually cooperative (i.e.
when both agents cooperate) game interactions over the last cycle. If agents
selected strategies randomly, 25% of game interactions would be mutually
cooperative. Figure 8 shows a frequency distribution histogram of the CC
measures for the random sample. As can be seen the majority of runs produced
low levels of cooperation between agents (not much more than would be achieved
if games were selected at random). However, the distribution shows some small
number of runs producing high amounts of cooperation. For the purposes of
analysis the top 10% of runs (based on level of cooperation) where classified
as “high cooperation”, the rest as “low cooperation”.
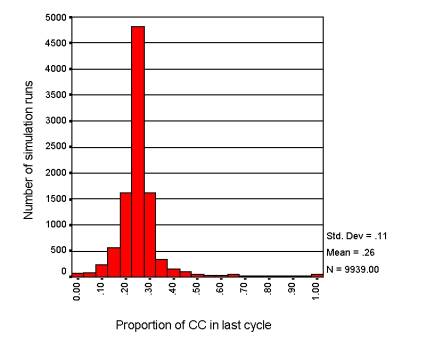
Figure
8
The
frequency of cooperation over the whole parameter space. A random sample of
approximately 10,000 points from the parameter space was used to generate this
frequency distribution.
The C4.5 algorithm was
applied to all the points from the sample and several regions were induced[3].
The two “best” regions (based on the number of high cooperation points
contained within them) are given below:
MT > 0, CR > 0, VG = 0, FM <= 0.1
This region contained
150 points of which 80% were “high cooperation”. The parameter ranges indicate
that:
·
Meme mutation is non-zero
·
Agents reduce confidence in their memes if they
are not satisfied
·
Game interaction is limited to a single
territory
·
The frequency of agent movement between
territories is low.
Inspection of
individual runs indicates that agents have only a small set of game interaction
partners. This makes the search space for coordinated game interactions small
and so it is more likely that agents will find a cooperative convention. Agents
are repeatedly meeting the same small number of agents and hence “learn” to
find a mutually satisfactory set of behaviours.
MT > 0, CR < 0, VG > 0, PM > 0.4, FG <= 0.1, FC > 0.1
This region contained
284 points of which 44% were “high cooperation”. The parameter ranges indicate
that:
·
Meme mutation is non-zero
·
Agents reduce confidence in their memes if they
are not satisfied
·
Game interaction is NOT limited to a single
territory
·
Cultural interaction events are, at least, one
order of magnitude more frequent than game interaction events.
A high frequency of
cultural interaction between games gives the agents more scope to adapt and
hence coordinate their game interactions. Agents are exchanging lots of memes
between game interactions and therefore “learn” to find a mutually satisfactory
set of behaviours.
4.2 Results - Hill-Climbing and Cluster Analysis
In order to apply
k-means cluster analysis, a set of points were located in the space[4]
that produced the maximum possible cooperation over the final (100th)
cycle of the simulation run. Maximum cooperation indicates that all games played in the final cycle
produced mutual cooperation. 39 such points were found by hill-climbing from
100 randomly chosen locations for 100 steps. This means that 10,000 individual
runs were executed (an identical computational effort to that used for the
random sample above). The points were normalised into unit space and clustered
into 5 clusters using k-means clustering (where the objective function was
Euclidean distance from cluster centriods). Various numbers of clusters were
tried but beyond 5 the objective function did not decrease significantly. Table
2 shows the cluster centriods and standard deviations of the points within each
cluster.
As before, cooperation
is high when game interaction is limited to single territory (cluster 3).
Notice however that cooperation is also high when BG and TG are high and BF is
low (clusters 1,2,4). In these clusters the biasing of game interaction towards
those sharing similar tag bits is high and the low value for BF indicates that
the majority of tag bits are culturally learned. However, what process could
produce high cooperation from such biasing? Based on observation of individual
runs the following is a hypothesis as to why tag biasing produces high
cooperation:
·
Tags combined with biasing create “game
interaction groups” sharing the same tags
·
Cultural learning (mutation and infection) can
change tags
·
Therefore, agents can “move” between groups
·
Unsatisfied agents tend to change their tags and
hence move between groups
·
Groups which satisfy their members (via
cooperation) tend to stabilise and recruit
·
Groups which do not satisfy tend to dissipate
·
Hence cooperation is promoted
It is argued that this may be viewed as a novel from of “cultural group selection”, where the “groups” are not extended in physical space but in “tag space”. Elsewhere, [6] we present a simplified model which tests this hypothesis under the assumption that agents are optimisers playing the single-round Prisoner’s Dilemma and found it to be robust over a range of parameter settings.
Cluster Centres and Sizes |
|||||
|
|
cluster
1 |
cluster
2 |
cluster
3 |
cluster
4 |
cluster
5 |
|
param |
size
12 |
size
4 |
size
4 |
size
12 |
size
7 |
|
|
ave
(stdv) |
ave
(stdv) |
ave
(stdv) |
ave
(stdv) |
ave
(stdv) |
B |
.35
(.27) |
.06
(.13) |
.88
(.14) |
.71
(.28) |
.86
(.28) |
|
M |
.28
(.26) |
.09
(.19) |
.50
(.43) |
.09
(.19) |
.09
(.09) |
|
PM |
.73
(.22) |
.78
(.15) |
.65
(.29) |
.85
(.17) |
.71
(.23) |
|
MT |
.05
(.03) |
.20
(.14) |
.80
(.01) |
.12
(.09) |
.05
(.04) |
|
CI |
.59
(.27) |
.32
(.23) |
.24
(.12) |
.33
(.21) |
.54
(.31) |
|
CR |
.74
(.16) |
.42
(.21) |
.12
(.06) |
.66
(.27) |
.60
(.24) |
|
MS |
.60
(.24) |
.50
(.25) |
.55
(.13) |
.76
(.21) |
.59
(.26) |
|
FG |
.39
(.23) |
.13
(.01) |
.88
(.09) |
.51
(.24) |
.32
(.30) |
|
FC |
.73
(.21) |
.70
(.29) |
.71
(.27) |
.66
(.16) |
.69
(.13) |
|
FM |
.34
(.31) |
.70
(.23) |
.00
(.00) |
.45
(.28) |
.71
(.23) |
|
BF |
.36
(.18) |
.19
(.10) |
.51
(.36) |
.27
(.16) |
.39
(.29) |
|
BG |
.86
(.11) |
.83
(.18) |
.29
(.19) |
.88
(.10) |
.42
(.28) |
|
BC |
.40
(.25) |
.53
(.31) |
.60
(.24) |
.64
(.18) |
.37
(.31) |
|
TG |
.72
(.21) |
.64
(.29) |
.83
(.00) |
.62
(.23) |
.27
(.26) |
|
TC |
.45
(.35) |
.34
(.34) |
.50
(.44) |
.78
(.15) |
.34
(.29) |
|
VC |
.68
(.18) |
.29
(.14) |
.59
(.37) |
.43
(.24) |
.31
(.16) |
|
VG |
.65
(.30) |
.38
(.24) |
.00
(.00) |
.45
(.39) |
.62
(.34) |
Table 2
Cluster
centres and sizes for five clusters identified by the k-means clustering method
when applied to 39 points found via hill-climbing in the parameter space.
5 Conclusion
Two distinct forms of game interaction
localisation (or “parochialism”) promote cooperation (among other mechanisms).
These take the form of spatial
parochialism - agents only playing games with others sharing the same
territory and cultural parochialism -
agents only playing games with others sharing the same or very similar tags.
The C4.5 algorithm combined with random sampling identified the spatial
mechanism as did k-means cluster analysis combined with hill-climbing. The
cultural mechanism was only found by the clustering method but this was applied
to an extended space (so this is not a true comparison of techniques).
Acknowledgements
This work would not have
been possible without the help of, discussions with, and suggestions from,
Prof. Jim Doran, Department of Computer Science, University of Essex,
Colchester, UK. The work presented in this paper was produced during the
authors work towards a PhD at the University of Essex. An EPSRC PhD studentship
award supported this work. The full text of the thesis is available online
(http://www.davidhales.com/thesis).
References
[1]
Armstrong, A. and Durfee, E. (1998). Mixing and Memory: Emergent Computation in
an Information Marketplace. In The
Proceedings of the 3rd International Conference in Multi-Agent Systems
(ICMAS'98). IEEE Computer Society Press, Los Alamitos, CA.
[2]
Axelrod, R. (1980). The Evolution of
Cooperation. Basic Books, New York.
[3]
Axelrod, R. (1995). The Convergence and Stability of Cultures: Local
Convergence and Global Polarization. SFI
Working Paper 95-03-028. Santa Fe Institute, Santa Fe, N.M.
[4]
Cohen, M., Riolo, L., Axelrod, R. (1999). The Emergence of Social Organization
in the Prisoner’s Dilemma: How Context-Preservation and other Factors Promote
Cooperation. SFI Working Paper 99-01-002.
Santa Fe Institute, Santa Fe, N.M. Available at
<http://www.santafe.edu/sfi/publications/>
[5]
Epstein, J. and Axtell, R. (1996). Growing
Artificial Societies: Social Science from the Bottom Up. The MIT Press,
Cambridge MA.
[6]
Hales, D. (2000)
Cooperation without Space or Memory: Tags, Groups and the Prisoner's Dilemma.
In Moss, S., Davidsson, P. (Eds.) Multi-Agent-Based Simulation. Lecture
Notes in Artificial Intelligence 1979. Berlin: Springer-Verlag.
[7]
Holland, J. (1992). Adaptation in Natural
and Artificial Systems. The MIT Press, Cambridge MA.
[8]
Holland, J. (1993). The Effect of Labels (Tags) on Social Interactions. SFI Working Paper 93-10-064. Santa Fe
Institute, Santa Fe, NM.
[9]
Holland, J. (1998). Emergence - From
Chaos to Order. Perseus Books, Cambridge, MA.
[10]
Hostetler, J. (1963). Amish Society.
Johns Hopkins Press, Baltimore.
[11]
Kramer, R. and Brewer, M. (1984). Effects of Group Identity on Resource Use in
a Simulated Commons Dilemma. Journal of
Personality and Social Psychology, 46(5):1044-1057.
[12]
Leyens, J. et al. (1994). Stereotypes and
Social Cognition. Sage, London.
[13]
Macy, M. and Skvoretz, J. (1998). Trust and Cooperation Between Strangers. American Sociological Review,
63:638-660.
[14]
Nowak, M. and Sigmund, K. (1992). Tit for tat in heterogeneous populations. Nature, 355:250-253.
[15]
Oakes, P. et al. (1994). Stereotyping and
Social Reality. Blackwell, Oxford.
[16]
Quinlan, J. R. (1993). C4.5: Programs For
Machine Learning. Morgan Kaufmann, San Mateo, California.
[17]
Riolo, R. (1997). The Effects of Tag-Mediated Selection of Partners in Evolving
Populations Playing the Iterated Prisoner's Dilemma. SFI Working Paper 97-02-016. Santa Fe Institute, Santa Fe, NM.
Available at: <http://www.santafe.edu/sfi/publications/>
[18]
Simon, H. A. (1990). A Mechanism for Social Selection and Successful Altruism. Science, 250:1665-1668.
[19] Spath, H, (1980). Cluster Analysis Algorithms for Data Reduction and Classification of Objects. Ellis Horwood, Chichester.
[20] Tajfel et al. (1971). Social Categorization and Intergroup behaviour. European Journal of Social Psychology, 1:149-177.