Wise-Up! - Smart Tag
Pairing Evolves and Persists
CPM Working Paper 02-90 (version 1)
David Hales - March 2002
dave@davidhales.com
Centre for Policy Modelling
The Business School
Manchester Metropolitan University
Manchester, UK.
Abstract
In a previous paper (Hales 2002a) we presented simulation results that demonstrated the evolution of “tag based” groups composed of cooperative (in-group altruistic) individual agents performing specialised functions. In a subsequent paper (Hales 2002b) we demonstrated that the efficiency of the specialisation process was highly dependent on the “searching strategy” employed by agents to locate in-group members with required skills. Specifically we showed that populations of agents with “smart” searching strategies outperformed populations of “dumb” (random) search strategies – even when the costs of smart searching were much higher. We hypothesised that in mixed populations smart strategies would out-evolve dumb ones. In this paper we test this hypothesis. Our results show that smart strategies do indeed outperform dumb strategies for significant periods of time but that dumb strategies persist also. The time series of individual runs show cycles of smart and dumb strategies in the population over generations.
Introduction
A previous model (Hales 2002a) demonstrated tag[1] processes that were sufficient to evolve sustained altruistic behaviour between specialised agents. In a second model (Hales 2002b) we demonstrated that populations composed of agents with smart partner selection strategies outperformed populations of dumb selection strategies. We hypothesised that in a mixed population composed of smart and dumb strategies the smart strategies would out-evolve the dumb ones. In this paper we test the hypothesis by implementing search strategies as an evolvable binary trait (representing smart or dumb). We show that even when the costs of the smart strategies are significantly higher than dumb strategies, smart strategies often out-perform dumb strategies and persist in the population. However, they do not eliminate dumb strategies completely. What we find is that the proportions of each strategy in the population change in cycles over time. We offer an explanation of this process with reference to the model dynamics. Essentially, the success of smart strategies ultimately leads to a population in which they are not required. This leads to invasion by dumb strategies which in-turn create the conditions under which smart strategies will out-evolve dumb strategies again. The result is an oscillating dumb / smart strategy mix. Even though smart strategies do not eliminate dumb strategies, the selective pressure for smart strategies is enough to sustain them resulting in a significant increase altruistic and cooperative behaviour – producing more efficient, specialised agent groups than is the case when only dumb strategies are implemented.
The Model
The model consists of a population of 100 evolving agents. The tag matching mechanisms follow that of Riolo et al (2001). The specialisation process follows Hales (2002a) and the smart and dumb searching strategies follow Hales (2000b) but are here represented as an evolvable binary trait. Here we briefly summarise the model. Each agent has four traits: a tag τ ε [0..1], a tolerance threshold 1 ≤ T ≥ 0, a skill type S ε {1, 2} and a search strategy Z ε {smart, dumb}. Initially, tags, thresholds, skills and strategies are allocated uniformly randomly. In each generation, each agent is awarded some number P of resources. Each resource is assigned a required skill type. Resources can only be “harvested” by agents possessing the required skill type. The skill type assigned to a resource is randomly assigned from those skills that do not match the receiving agents skill[2]. An agent therefore is never awarded a resource that matches its skill type. Since the agent cannot harvest the resource, it searches for another agent in the population with required skill and tag values.
Donation of the resource only occurs if a recipient is found with the required skill type and with a sufficiently similar tag value. A recipient tag is considered to be sufficiently similar if it is within the tolerance of the donating agent. Specifically, given a potential donor agent D and a potential recipient R a donation will only be made when | τD – τR | ≤ TD. This means that an agent with a high T value may donate to agents over a large range of tag values. A low value for T restricts donation to agents with very similar tag values to the donor. In all cases donation can only occur when the skill type of the receiving agent matches the skill type associated with the resource. If a donation is made the donating agent incurs a cost, c, and the recipient gains a benefit, b (since it can harvest the resource). In all experiments given in this paper, the benefit b = 1. The cost, c, depends on the value of the search strategy Z. When Z = smart, c = 0.5, when Z = dumb then c = 0.1. Here we capture the notion that “smart searching” is more costly than dumb searching.
If an agent uses a dumb search strategy the search simply involves a single random selection from the population. If the randomly selected partner does not have the correct tag and skill type then no donation takes place. In contrast, if an agent uses a smart strategy it searches the entire population for a potential recipient with appropriate tag and skill values. Here, we do not model the actual mechanism employed but just the outcome assuming a smart strategy were used. We assume that some efficient mechanism exists which allows agents to find a potential recipient in the population if one exists[3]. As discussed previously (Hales 2002a) a number of plausible mechanisms can be hypothesised – based on spatial and/or cognitive relationships (e.g. “small world” social networks, meeting places, central stores etc.).
After all agents have been awarded P resources and made any possible donations the entire population is reproduced. Reproduction is accomplished in the following manner – each agent is selected from the population in turn, its score is compared to another randomly chosen agent, and the agent with the highest score is reproduced. Mutation is applied to each trait of each offspring. With probability 0.1 the offspring receives a new tag (uniformly randomly selected). With the same probability, gaussian noise is added to the tolerance value (mean 0, standard deviation 0.01). When T < 0 or T > 1, it is reset to 0 and 1 respectively. Also with probability 0.1 the offspring is given a new skill type (uniformly randomly selected) and with the same probability the search strategy is changed.
Results
The first set of results, in Table 1, below, show the donation rates achieved as a percentage of total awards made, the average tolerance values and the average number of smart agents in a 2-skill scenario. The shaded columns are results from previous papers (Hales 2002a, 2002b) given for comparison purposes.
All results are over 30,000 generations with 30 replications. Each replication represents an individual run started with a different pseudo-random number seed. The standard deviations are over the 30 runs executed for each unique P value setting[4] and strategy. The column labelled “dumb” shows results from previous experiments using a dumb random recipient search strategy (Hales 2002a). In this condition all agents in the population use a dumb random search strategy. The columns labelled “smart” show results when all agents use a smart strategy (Hales 2002b).
The “mixed” columns give the new results obtained when the searching strategy is allowed to evolve as a binary trait (as described above). The “Ave. Z=smart” column gives the average proportion of smart agents in the population (averaged over each generation). So if this value were 1 it would mean that at the end of each generation (for 30,000 generations) all agents were using smart searching strategies (i.e. Z=smart for all agents at all times). The values in this column are only meaningful with reference to the associated “mixed” columns. Additionally, these values give no indication of the time dynamics of strategy evolution.
In all cases the cost to a donor agent of using a dumb strategy is c = 0.1, for smart it is c = 0.5. The benefit, b, passed to any recipient of a donation is held at 1.
Figures 1 and 2 present some of the data from table 1 (the 2-skill scenario) in graphical form. Figure 1 shows the donation rates for dumb, smart and mixed populations. Note that for mixed populations the donation rate is significantly higher than for dumb populations. This indicates that smart strategies are being selected-for by the evolutionary process and that this improves donation rates. However, the donation rate is significantly lower than when the population is set to all smart – indicating that smart strategies are not completely dominating the population and stabilising. Figure 2 shows the donation proportion for the mixed case along with the average proportion of the population using the smart search strategy. This illustrates clearly that as the number of rewards given to each agent increases the proportion of agents holding smart strategies decreases.
|
Awards (P) |
Donation Rate – Ave % (st.dev. in brackets) |
Tolerance – Ave (st.dev. in brackets) |
Ave % Z=smart |
||||
|
|
Dumb |
Mixed |
Smart |
Dumb |
Mixed |
Smart |
|
|
1 |
1.5 (0.001) |
11.7 (0.001) |
29.5 (0.081) |
0.028 (0.002) |
0.007 (0.001) |
0.021 (0.084) |
0.358 (0.002) |
|
2 |
1.1 (0.000) |
13.9 (0.002) |
47.9 (0.087) |
0.019 (0.001) |
0.006 (0.000) |
0.030 (0.111) |
0.320 (0.001) |
|
3 |
1.0 (0.000) |
25.3 (0.004) |
59.9 (0.035) |
0.015 (0.001) |
0.010 (0.000) |
0.017 (0.048) |
0.230 (0.002) |
|
4 |
0.9 (0.000) |
37.7 (0.002) |
66.3 (0.046) |
0.013 (0.000) |
0.014 (0.005) |
0.028 (0.105) |
0.193 (0.001) |
|
6 |
0.9 (0.000) |
41.9 (0.001) |
70.9 (0.010) |
0.011 (0.001) |
0.017 (0.004) |
0.011 (0.014) |
0.165 (0.000) |
|
8 |
0.9 (0.000) |
42.9 (0.001) |
73.1 (0.002) |
0.010 (0.000) |
0.018 (0.001) |
0.009 (0.000) |
0.151 (0.000) |
|
10 |
2.1 (0.002) |
43.4 (0.001) |
74.5 (0.002) |
0.010 (0.000) |
0.020 (0.001) |
0.009 (0.000) |
0.143 (0.000) |
|
20 |
12.9 (0.000) |
43.6 (0.001) |
77.3 (0.002) |
0.025 (0.003) |
0.023 (0.004) |
0.010 (0.001) |
0.130 (0.000) |
|
40 |
13.9 (0.015) |
43.5 (0.001) |
79.3 (0.033) |
0.098 (0.190) |
0.023 (0.004) |
0.038 (0.107) |
0.125 (0.000) |
Table 1
Donation rates and
tolerance levels for different numbers of awards in a 2-skill scenario (i.e.
when S e
{1,2}) and for different search strategies. The values in brackets are standard
deviations over the 30 replications. The shaded columns are results from
pervious papers (Hales 2002a, 2002b) given for comparison purposes. The Ave.
Z=smart column gives the average proportion of smart (searching) agents in the
population (averaged over each generation).
This can be explained as follows: when many awards are being made, agents using the dumb strategy have a higher chance of finding at least some matching partners for donation. Conversely, the smart strategy agents will always find a matching partner if one exists – however the costs to the smart agent are higher. When an in-group of agents reaches a significant size (generally sharing identical tags) then there will be little advantage to the group in the use of the smart strategy – since dumb searching will be almost as good.
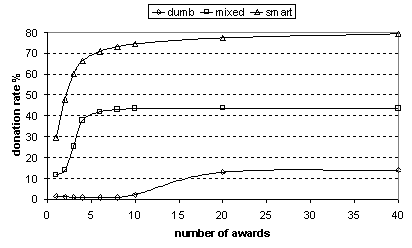
Figure 1
Comparison of
donation rates for dumb, smart and mixed populations for different numbers of
resource rewards to each agent when skills = 2. Notice the significant increase
in donation rates in the mixed population relative to the dumb population. This
indicates there is some selective pressure for smart strategies.
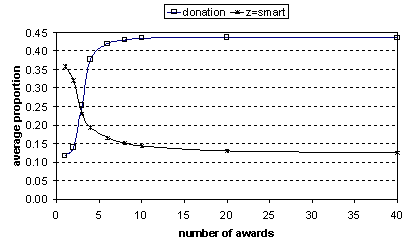
Figure 2
Average
proportion of smart agents in the population over all generations for different
numbers of resource awards for 2-skill scenario. For comparison purposes the
donation rate for the mixed case is here included (mapped as a proportion
rather than percentage as shown in figure 1). Notice that as the number of
awards increases the proportion of smart agents decreases but does not go to
zero.
However, why don’t smart strategies dominate the population when the number of rewards is low? To answer this question we advance an explanation that produces a hypothesis concerning the dynamics of strategy evolution. When a large number of smart strategies predominate in the population, agents, practicing dumb strategies, have an opportunity to “free-ride”. The smart agents will incur a large cost locating and donating to dumb agents but this will not be reciprocated. Given this, why don’t smart strategies disappear completely? They do not disappear because tag mutation and low tolerance (notice in table 1 tolerance is low when rewards are low) keep a diversity of “in-groups” (generally all sharing the same tag value) in the population – i.e. a diversity of tags. Given this, tag groups, which become invaded and dominated by dumb strategies, become dysfunctional. The dumb invaders sow the seeds of their own destruction. By exploiting the group, they kill it. In this situation we expect other tag groups that are composed entirely of smart agents to outperform the dysfunction groups. This is the same process that allows specialisation to evolve (Hales 2002a). The constant formation of new tag groups produces selective pressure for group level adaptations. The way that such tag based group processes can suppress free-riding within a group is illustrated starkly in Hales (2000) where a similar model is applied to the one-shot prisoner’s dilemma[5].
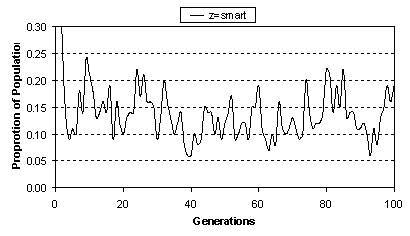
Figure 3
Proportion of
smart agents over 100 generations for a typical run. Number of awards = 10,
number skills = 2. The proportion oscillates over time. The oscillation appears
to be occurring on several scales. The initially high value (not fully shown on
the scale) is due to the uniformly random initialisation (from which we expect
50% of agents to be initialised as smart).
From the above analysis we hypothesize that the time dynamics (over generations) of strategy evolution should show a cyclical signature (i.e. phases of high and low proportions of smart strategies over time). Figure 3 shows the proportion of smart agents in the population over 100 generations of a typical run for the 2-skill scenario when awards = 10. As can be seen, the proportion of smart agents does not stay constant over time but oscillates on several scales.
Results from the 5-skill scenario are given in table 2 and figures 4 and 5. The results are qualitatively similar to the 2-skill scenario but the increase in donation rates over the “all dumb” population is less spectacular (though significant). Interestingly, the proportion of smart agents in the population over different reward values is very similar to the 2-skill scenario (compare figures 2 and 5). So, the more modest increase in cooperation obtained in the 50ksill scenario is not a result of less agents evolving smart strategies. This indicates that when groups are required to be more specialised this degrades the effect of smart strategies when they do not dominate the population.
|
Awards (P) |
Donation Rate – Ave % (StDev. in brackets) |
Tolerance – Ave (StDev. in brackets) |
Ave. Z=smart |
||||
|
Dumb |
Mixed |
Smart |
Dumb |
Mixed |
Smart |
||
|
1 |
1.5 (0.001) |
6.5 (0.001) |
29.5 (0.081) |
0.028 (0.002) |
0.008 (0.001) |
0.021 (0.084) |
0.395 (0.002) |
|
2 |
1.1 (0.000) |
5.9 (0.001) |
47.9 (0.087) |
0.019 (0.001) |
0.007 (0.001) |
0.030 (0.111) |
0.357 (0.002) |
|
3 |
1.0 (0.000) |
6.1 (0.001) |
59.9 (0.035) |
0.015 (0.001) |
0.007 (0.001) |
0.017 (0.048) |
0.325 (0.002) |
|
4 |
0.9 (0.000) |
7.4 (0.002) |
66.3 (0.046) |
0.013 (0.000) |
0.007 (0.000) |
0.028 (0.105) |
0.283 (0.002) |
|
6 |
0.9 (0.000) |
15.6 (0.002) |
70.9 (0.010) |
0.011 (0.001) |
0.012 (0.002) |
0.011 (0.014) |
0.170 (0.002) |
|
8 |
0.9 (0.000) |
18.8 (0.001) |
73.1 (0.002) |
0.010 (0.000) |
0.014 (0.000) |
0.009 (0.000) |
0.141 (0.001) |
|
10 |
2.1 (0.002) |
20.0 (0.001) |
74.5 (0.002) |
0.010 (0.000) |
0.015 (0.001) |
0.009 (0.000) |
0.130 (0.000) |
|
20 |
12.9 (0.000) |
21.6 (0.006) |
77.3 (0.002) |
0.025 (0.003) |
0.023 (0.013) |
0.010 (0.001) |
0.117 (0.000) |
|
40 |
13.9 (0.015) |
22.0 (0.006) |
79.3 (0.033) |
0.098 (0.190) |
0.034 (0.057) |
0.038 (0.107) |
0.114 (0.000) |
Table 2
Donation rates and
tolerance levels for different numbers of awards in a 5-skill scenario (i.e.
there are 5 skill types, such that each agent has a skill S e
{1,2,3,4,5}) and for different search strategies. The values in brackets are
standard deviations over the 30 replications. The shaded columns are results
from pervious papers (Hales 2002a, 2002b) given for comparison purposes. The
Ave. Z=smart column gives the average proportion of smart (searching) agents in
the population (averaged over each generation).
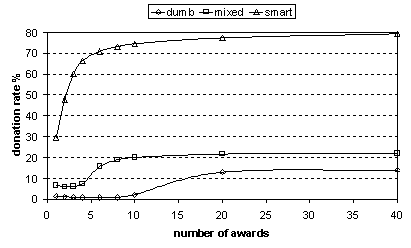
Figure4
Donation rates for dumb, smart and mixed populations for different numbers of awards in the 5-skill scenario. The values used for the chart are taken from table 2.
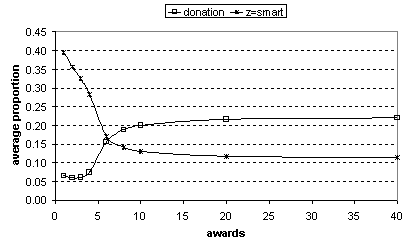
Figure 5
Average
proportion of smart agents in the population over all generations for different
numbers of resource awards for 5-skills. For comparison purposes the donation
rate for the mixed case is here included (mapped as a proportion rather than
percentage as shown in figure 1). Notice that as the number of awards increases
the proportion of smart agents decreases but does not go to zero. A very
similar signature is given for 2-skills (see figure 2).
Discussion
The major conclusion of the paper
is that smart partner searching strategies (even when significantly more
costly than dumb strategies) derive enough evolutionary advantage to persist in
a population of agents. They result in a significant improvement in the amount
of altruistic behaviour produced and hence help to support in-group
specialisation.
However, in the model presented here, smart strategies do not completely dominate the population or even takeover a majority of the population. Additionally, high degrees of in-group specialisation do not appear to benefit as much from similar proportions of smart agents in the population.
We advance the model as an existence proof in the artificial domain that non-random interactions between agents can be selected for by a simple evolutionary process. Given this, models should not discount non-random mixing – especially in the context of models of complex social behaviours.
Biologically inspired models (Riolo 2002) and culturally oriented models (based on the replicator dynamics) often assume random mixing of populations of agents (Binmore 1998). However, it would seem that when agents in such models are meant to represent individuals with even rudimentary abilities to learn and distinguish between others based on some evolvable observable characteristic then such an assumption is hard to support. In the model present in this paper we evolve behaviours far away from simple random mixing. When applied to the understanding of human-like societies assumptions of random mixing preclude the analysis of the evolution of complex social structures.
The large selective advantage to non-random mixing (locating one’s in-group) indicates a possible trajectory for the evolution of relatively sophisticated socio-cognitive mechanisms. Starting from locating and distinguishing in-group from out-group it would seem that more sophisticated social behaviours, such as norm enforcement via ostracism (or direct punishment) and the sharing and distribution of collective goods and costs, could also become evolutionarily tenable.
We have already demonstrated the evolution of primitive in-group “roles” linked to resource specialisation. However, with more sophisticated group processes we might expect more refined roles to be possible – such as group organisational and informational roles (not directly linked to resource harvesting). In order to model such processes we need to move away from simple “dyadic” two-agent interactions of donation to something more like group level sharing.
Acknowledgements
Work presented here has greatly benefited from discussions and ideas from Bruce Edmunds, Centre for Policy Modelling, Manchester Metropolitan University, UK.
References
Binmore, K. (1998). Game Theory and the Social Contract. Volume 2: Just Playing. The MIT Press, Cambridge, MA.
Hales, D. (2000), “Cooperation without Space or Memory: Tags, Groups and the Prisoner's Dilemma”. In Moss, S., Davidsson, P. (Eds.) Multi-Agent-Based Simulation. Lecture Notes in Artificial Intelligence 1979. Berlin: Springer-Verlag (available at: http://www.davidhales.com).
Hales, D. (2001), Tag Based Cooperation in Artificial Societies. Unpublished Ph.D. Thesis, Department of Computer Science, University of Essex (available at: http://www.davidhales.com/thesis).
Hales, D. (2002a), Cooperation and Specialisation without Kin Selection using Tags. CPM Working Paper 02-88. The Centre for Policy Modelling, Manchester Metropolitan University, Manchester, UK (available at: http://www.cpm.mmu.ac.uk/cpmreps.html).
Hales, D. (2002b), Smart Agents Don’t Need Kin – Evolving Specialisation and Cooperation with Tags. CPM Working Paper 02-89. The Centre for Policy Modelling, Manchester Metropolitan University, Manchester, UK (available at: http://www.cpm.mmu.ac.uk/cpmreps.html).
Hales, D.
(forthcoming), All-For-One and One-For-All – Evolving In-Group Sharing with
Tags.
Riolo, R., Cohen, M. D. & Axelrod, R. (2001), Cooperation without Reciprocity. Nature 414, 441-443.
Sigmund & Nowak (2001), Tides of tolerance. Nature 414, 403-405.