 Gatherer, D. (2003). Birth of a
Meme: the Origin and Evolution of
Collusive Voting Patterns in the Eurovision Song Contest.
Journal of Memetics - Evolutionary Models of Information Transmission,
8.
http://cfpm.org/jom-emit/2004/vol8/gatherer_d_letter.html
A reply to
the letters of Edmonds (2002) and Duthie (2004):
Birth of a Meme: the Origin and Evolution of
Collusive Voting Patterns in the Eurovision Song Contest
Derek Gatherer
dgatherer@talk21.com
1. Introduction
Edmonds (2002) has set
down three challenges to the
memetics community: a) a conclusive case-study; b) a theory for when
memetic models are appropriate; and c) simulation of the emergence of a
memetic process. More recently, Duthie (2003)
has called for a greater
focus on practical examples, and a retreat from definitional debates.
In doing so, Duthie echoes similar calls from Hull (2000),
and the
"Symposium on Memetics" panel (Hales 1998).
I should like to reply to these calls, essentially
for two purposes: firstly to demonstrate that empirical case-studies
can be carried out within the behaviour/artefact formulation of
memetics, but also secondly to illustrate how difficult it is to steer
clear of definitional debate. In the space of a letter, it is neither
possible nor desirable to perform a thorough analysis, and what follows
is, like the two case studies in Duthie, merely intended to serve as an
illustration. It will be seen, however, that the issue of definition of
a meme is crucial to the design and interpretation of the analysis.
In passing, it ought to be mentioned that Duthie's
(2003) reference to the debate between "those who advocate the
contagion-like or viral metaphor and those who prefer the gene
metaphor" (quoting Aunger 2002),
having resulted in "both groups
appearing to claim that the other is retarding progress in memetics",
is actually not strictly correct. The virus versus gene metaphor debate
is in fact far older than the controversies of the late 90s, and can be
seen most acutely in a comparison of the work of Cavalli-Sforza &
Feldman (1981) against that of
Cullen (2000). The "retarding progress"
debate is much more recent and is really between
fact-orientated/quantitative/behavioural approaches and
ad-hoc-theory-driven/pseudo-psychological approaches within the "viral"
school, broadly defined. It is about things like analysing data
quantitatively as opposed to merely musing on it. In that respect, I am
as firmly in favour of detailed case studies as Duthie (2003), as
correctly suggested by Edmonds (2002).
2. The Case Study
2. 1 Background
Since the early 1960s, the Eurovision Song Contest
has been an annual competition between member states of the European
Broadcasting Union. The modern form of the contest originated in 1974,
when the present judging system was adopted, and works as follows. Each
participating country sends a representative to the competition, held
in the territory of the current holder of the trophy. The songs are
performed and a jury in each of the participant countries votes for its
favourite song. The rules of the contest specify that the juries should
judge the quality of the song and not of the performance. Juries are
not permitted to vote for the song of their own country. Since the
mid-90s, some countries have dispensed with juries and opted for a
system of national telephone voting, effectively turning the entire
interested population of the country into jury members. In the words of
the well-known BBC disc jockey John Peel, "the reason the music
industry is not interested in the Eurovision Song Contest, is that it
is impossible to fix the result". That is certainly true. Nevertheless,
there have been persistent suggestions that some countries appear to be
regularly voting for each other in a kind of reciprocal altruism, and
also that other political considerations have come into play - such as
BBC presenter Terry Wogan's analysis of the 2003 contest, that the
United Kingdom entry had suffered from "post-Iraq backlash".
The precise mechanics of voting are as follows. The
jury awards its favourite song 12 points, the second favourite 10
points, the third 8 points, and then a further 7 songs in descending
order from 7 to 1 points. During the period under consideration, the
number of countries participating in the contest varied from 18 to 25.
Therefore the probability of receiving no points at all from any
particular other country in any particular year varies from 0.41 to
0.59. This system was used for the last time in 2003, and from this
year will be replaced by a novel, more tournament-like, mechanism
involving an eliminatory round. It is not clear what effect this will
have on voting patterns, but it is probably partly intended to make
collusive voting more difficult.
2. 2 Method
and Results
Scores for all contests between 1974 and 2002
inclusive, were downloaded from http://www.kolumbus.fi/jarpen/ with permission. The average
scores for each pairwise combination of countries were calculated over
this period, in the form of three statistics: a) the average score
awarded from country 1 to country 2; b) the average score awarded from
country 2 back to country 1; and c) the average total shared between
country 1 and country 2. A simulation of 100 contests was carried out,
with completely random voting. A Perl script for the random contest is
available on request. The statistics were calculated for each pairwise
combination in the 100 random contests, and the resulting means and
standard deviations used to derive z-scores for the statistics for the
real contests. The country pairs deviating most from random voting are
shown in Table 1.
|
pair 1
|
pair 2
|
1 to 2
|
2 to 1
|
years
|
total
|
z
|
1-2 z
|
2-1 z
|
|
CY
|
GR
|
10.7
|
9.7
|
15
|
20.3
|
52.7
|
38.6
|
34.0
|
|
LA
|
EE
|
11.3
|
10.7
|
3
|
22.0
|
27.0
|
19.1
|
18.1
|
|
SE
|
DK
|
5.1
|
7.1
|
22
|
12.2
|
18.8
|
5.1
|
21.3
|
|
ML
|
SK
|
6.7
|
11.3
|
3
|
18.0
|
18.8
|
6.2
|
20.0
|
|
ML
|
HR
|
6.2
|
7.6
|
10
|
13.8
|
18.5
|
9.0
|
16.8
|
|
GB
|
MC
|
6.0
|
10.3
|
4
|
16.3
|
17.5
|
5.1
|
19.5
|
|
EE
|
SE
|
7.0
|
6.6
|
8
|
13.6
|
16.0
|
11.7
|
10.4
|
|
RO
|
MK
|
8.3
|
8.0
|
3
|
16.3
|
15.4
|
10.8
|
10.4
|
|
HR
|
MK
|
6.7
|
9.0
|
3
|
15.7
|
14.0
|
6.2
|
13.3
|
|
SL
|
HR
|
7
|
5.25
|
8
|
12
|
11.4
|
11.7
|
3.9
|
|
RO
|
RU
|
8.333
|
6
|
3
|
14
|
11.3
|
10.8
|
4.6
|
|
GB
|
CH
|
4.76
|
5.92
|
25
|
11
|
10.9
|
2.8
|
12.5
|
|
CY
|
YU
|
5.9
|
5.2
|
10
|
11
|
8.4
|
7.5
|
4.1
|
|
SE
|
IS
|
5.067
|
5.4
|
15
|
10
|
7.4
|
4.0
|
6.3
|
|
EE
|
DK
|
5.2
|
6.4
|
5
|
12
|
7.3
|
2.8
|
7.4
|
|
EE
|
IE
|
5.143
|
5.143
|
7
|
10
|
4.5
|
3.1
|
3.2
|
Table 1:
Pairs of countries deviating the most from
a random voting pattern. Pair 1 and Pair 2: the names
of the countries (CY Cyprus, GR Greece, LA Latvia, EE Estonia, SE
Sweden, DK Denmark, ML Malta, SK Slovakia, HR Croatia, GB Great
Britain, MC Monaco, RO Romania, MK Macedonia, SL Slovenia, RU Russian
Federation, CH Switzerland, YU Yugoslavia, IS Iceland, IE Ireland). 1
to 2: average votes from pair 1 to pair 2. 2 to 1: average
votes from pair 2 to pair 1. Years: total number of years both
countries have appeared together in the contest. Total: average
sum of reciprocal votes for both countries. Recip z: z-score
for total. 1-2 z: z-score for 1 to 2. 2-1 z: z-score for
2 to 1.
A z-score of 1.65 is significant at the
5% level, a score of 2.33 at
the 1% level. All of the scores in Table 1 are
therefore highly
statistically significant. Some of these scoring patterns are
distinctly asymmetrical. For instance, although Malta and Slovakia both
have significantly elevated rates of reciprocal voting over the 3 years
they have both appeared in the contest (1994, 1996 and 1998), Slovakia
has tended to give double the number of votes to Malta as it receives
in return. However, it should be noted that Malta performed quite well
overall in those three years, (5th, 10th and 3rd respectively), so some
of this may be attributed to genuine vote-catching qualities of the
relevant Maltese songs.
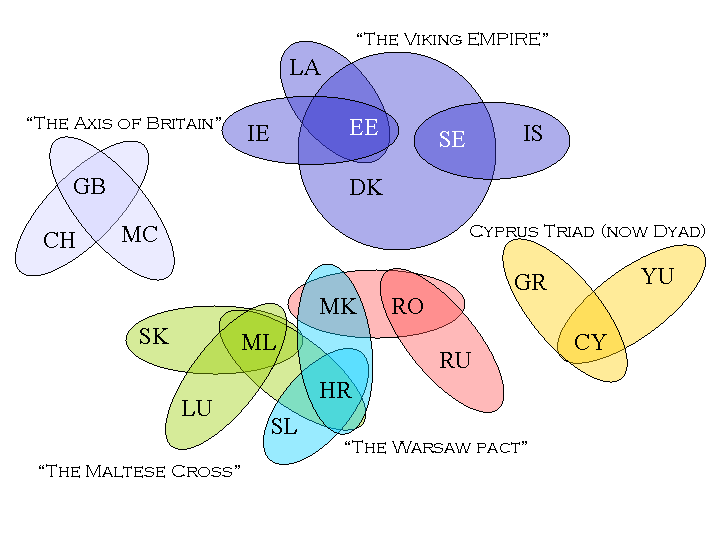
The 16 significant pairwise voting
relationships in Table 1
can be
expressed graphically by means of a Venn diagram (Figure 1). This
reveals the existence of two large power blocs and two smaller axes.
The more compact of the two largest blocs is here termed the "Viking
Empire", owing to its uncanny resemblance to the area under Norse
control in the early Middle Ages, and consists of Scandinavian and
Baltic States, along with Ireland. The second of the large blocs is
more diffuse and is really an intersection of two axes, a "Maltese
Cross" composed of Malta, Slovakia, Luxemburg and Croatia, intersecting
with a "Warsaw Pact" composed of states of the former Communist east.
The two peripheral axes are a Britain-Switzerland-Monaco triad
(financial centres?), and a Greece-Cyprus-Yugoslav axis, now reduced to
a Greece-Cyprus dyad following Yugoslavia’s last appearance in 1992 and
the subsequent drift of Croatia into the connecting position between
the "Warsaw Pact" and the "Maltese Cross".

Figure 1:
Venn diagram representation of the
significant voting partnerships in Table 1. (CY Cyprus, GR Greece, LA
Latvia, EE Estonia, SE Sweden, DK Denmark, ML Malta, SK Slovakia, HR
Croatia, GB Great Britain, MC Monaco, RO Romania, MK Macedonia, SL
Slovenia, RU Russian Federation, CH Switzerland, YU Yugoslavia, IS
Iceland, IE Ireland)
Such classification is merely
whimsical, but the basic fact remains
that statistically significant reciprocal voting does tend to have a
geographically non-random distribution, and in four of the five
clusters, to be suggestive of older historical alliances (the "Maltese
Cross" being the only exception). The question now is: can we apply
memetics to this situation and if so, how?
3. Discussion
One thing is clear. There is no central
co-ordination of voting in
the Eurovision Song Contest. Reciprocal voting is something done by
individuals, and since the introduction of telephone voting, it is
something which is often done on a mass scale. It requires a large
number of people to act independently of each other in a predictable
manner in the expectation that other people, often hundreds of miles
away and with whom they have never had any personal contact, will act
in another predictable manner. At first glance, this appears to be
potentially an imitative phenomenon. A person, having observed a
contest, and having seen what voting patterns occur, may resolve to
cast a vote in the next contest in the same way. However, if this is
the case, we ought to see the gradual increase of collusive voting as
the pattern spreads through the voting pools of the two countries
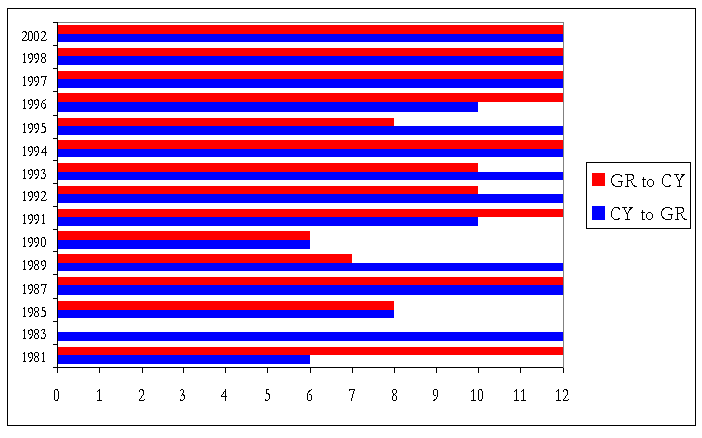
concerned. The historical voting pattern between the leading pair in
Table 1, Greece and Cyprus, is shown in Figure 2.

Figure 2:
Voting pattern from Greece to Cyprus, and
Cyprus to Greece within the period 1981 to 2002, encompassing all the
years of the modern voting system era (post-1975) when both countries
were represented (15 occasions). Mutual maximum marks have been awarded
on 5 occasions, and unilateral maximum marks on a further 8 occasions.
Figure 2
demonstrates that there was initially no predictable
pattern of voting. Indeed Greece gave no points to Cyprus in 1983. The
pattern starts to establish itself after the mutual 8 points in 1985,
leading to mutual maximum points in 1987. The pattern breaks down a
little in the late 80s to early 90s, but by the late 90s mutual
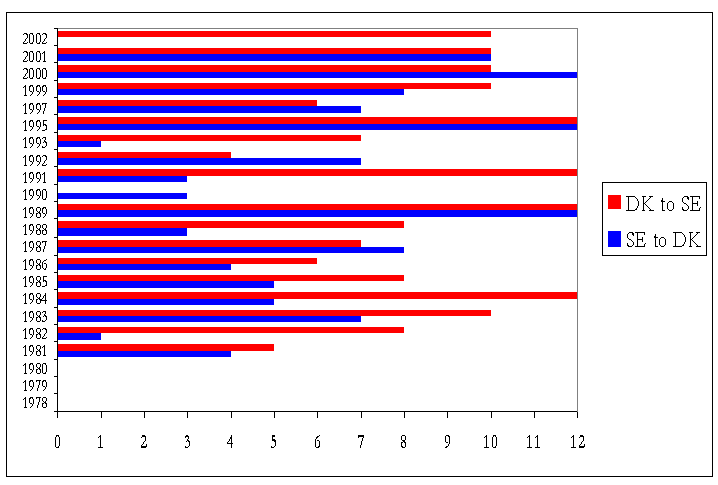
maximums seem virtually guaranteed. A slightly more complex pattern is
seen when considering Sweden and Denmark in Figure
3. On the first
three occasions, no points were awarded by either side, but from 1981
Denmark took the lead in awarding increasingly high points to Sweden.
1990 saw a sudden withdrawal of points by Denmark, but the relationship
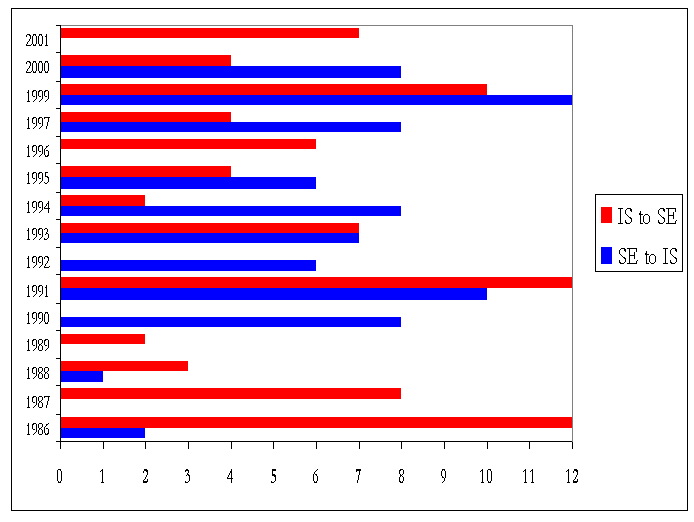
recovered immediately. Figure 4 shows the
relationship between Iceland
and Sweden. Initial high marks from Iceland produced little or no
Swedish response, and the Icelandic vote gradually declined in the late
80s. However, the position then seems to have reversed with Sweden
taking the lead in high voting for Iceland.

Figure 3:
Voting pattern from Sweden to Denmark,
and Denmark to Sweden within the period 1978 to 2002, encompassing all
the years of the modern voting system era (post-1975) when both
countries were represented (22 occasions). Mutual maximum marks have
been awarded on 2 occasions, and unilateral maximum marks on a further
3 occasions.

Figure 4:
Voting pattern from Sweden to Iceland,
and Iceland to Sweden, within the period 1986 to 2001, encompassing all
the years of the modern voting system era (post-1975) when both
countries were represented (15 occasions).
These three examples demonstrate that collusive voting patterns are
not steady, but wax and wane, often in visible response to the previous
year’s vote.
4. Conclusion
In summary, it can be seen that:
- the Eurovision Song Contest is a purely cultural phenomenon -
there is no biological selective advantage associated with winning or
losing.
- Nevertheless, behaviour has evolved to share votes in mutually
beneficial partnerships, often with one country taking a lead in
courting another..
- Many more of these have sprung up in recent years (see Table 1),
as new countries join the contest, adopting almost immediately the
process that has evolved gradually among the long-standing members.
We have here several of the component
parts of a memetic
evolutionary system: confidence that biological evolution is not at
work, evidence of a contagious spread of a cultural trait, and finally
adaptation of a different evolutionary system (i.e. the rules of the
contest) to cope with changes in the system under consideration (the
two-tier system now being introduced from 2004 is partly designed, one
suspects, to eliminate some of the evolved behaviour discussed here).
This is not exactly the simulation of the emergence of a memetic
process, as requested by Edmonds, but it is the observation of the
birth, life and (from next year) death of a memetic ecosystem. This may
not be a conclusive case study - there are still far too many
unanswered questions, for instance: why did collusion evolve where it
did and not elsewhere?; was the initial stimulus intentional or a
co-incidental consonance of votes that was in some way ‘interpreted’ as
an overture to collusion?; what role did commentators’ complaints about
collusion have in spreading/creating the phenomenon? However, I hope it
satisfies about one and a half of Edmonds’ three criteria.
Regarding Duthie’s comments, I believe
that the issue of
definitional debates cannot simply be ignored. It is difficult to see
how the above example could have been produced using the ‘thought
contagionist’ framework. I would have been required to identify beliefs
and then derive evolutionary epidemiological scenarios for their spread
to other individuals, identify recruitment, retention and drop-out
events, express them in ‘the calculus of mnemon instantiations’ and
then somehow fit them into a complicated set of differential equations.
Applying this process to the above scenario would seem to be impossibly
contrived. In any case, there has been no thought contagionist analysis
case that has actually gone through this entire process from beginning
to end, nor in fact has there been one that has quantitatively handled
any data. That paradigm has an as yet unbridged chasm between its
symbolic theory (the calculus of mnemon instantiations and the
differential equations), and its actual practice, which seems to be
veering increasingly towards journalistic commentary on things like
financial market and wars.
Duthie is right, the more practical
case studies the better. But to
achieve those case studies, we need to concentrate on memes as
behaviours and artefacts. That way, the experimental material is right
before us, forks, paperclips and votes, among many other things. In the
parlance of Eurovision, other methods can expect "null points".
References
Aunger R (2002) The Electric Meme: A
New Theory of How We Think.
New York, NY: The Free Press.
Cavalli-Sforza LL &
Feldman MW (1981) Cultural Transmission
and Evolution. Princeton: Princeton University Press.
Cullen BS (2000) Contagious ideas : on
evolution, culture,
archaeology, and Cultural Virus Theory / Ben Sandford Cullen ;
collected writings edited by James Steele, Richard Cullen and
Christopher Chippindale. Oxford: Oxbow Books.
Duthie AB (2003). A Letter on: The Fork and
the Paperclip: A Memetic
Perspective.Journal of Memetics - Evolutionary Models of Information
Transmission, 8. http://cfpm.org/jom-emit/2004/vol8/duthie_ab.html
Edmonds B
(2002) Three Challenges for the Survival of Memetics. Journal of
Memetics - Evolutionary Models of Information Transmission, 6. http://cfpm.org/jom-emit/2002/vol6/edmonds_b_letter.html
Gatherer D (1998) Why the Thought Contagion Metaphor is Retarding
the Progress of Memetics. Journal of Memetics - Evolutionary Models
of Information Transmission, 2.
http://cfpm.org/jom-emit/1998/vol2/gatherer_d.html
Hales D (1998) Report on the Panel
Discussion that occurred at the
Symposium on Memetics. Journal of Memetics - Evolutionary Models of
Information Transmission 2. http://cfpm.org/jom-emit/1998/vol2/panel_discussion.html
Hull D (2000) Taking Memetics Seriously:
Memetics will be what we
make it. In: Aunger R (ed.), Darwinizing Culture: The Status of
Memetics as a Science. Oxford: Oxford University Press, 43-67. http://cfpm.org/jom-emit/1998/vol2/gatherer_d.html
© JoM-EMIT 2004
Back to
Issue 2 Volume 8
 Gatherer, D. (2003). Birth of a
Meme: the Origin and Evolution of
Collusive Voting Patterns in the Eurovision Song Contest.