Margaret Edwards, François Goreaud, Sylvie Huet,
Guillaume Deffuant, LISC, Cemagref
Models connecting water consumption and resource
evolution at different levels of aggregation (example of the Orb valley)
7.1.1 Description
Domain Context
This model deals with water quantity in the Orb
River Basin (which impacts on water quality). Water withdrawals depend,
on the one hand, on agricultural practices linked to irrigation, on the
other hand, on domestic use, which vary in time and over the year.
It will be an element in the reflection upon
linking models of water and population at different scales; and more
specifically, the possible advantages in this context, of individual
over aggregate description for the population sub-model. In the series
of models we will implement, we consider hydrological models defined at
two grains (different size of sub-basins), and population models, which
are individual-based and aggregated in spatial cells.
Our modelling choices, influenced partly by
constraints in terms of time of development (and acceptable complexity
of the sub-models relative to the study of their linking), has
led us to focus on the question of resource quantity. This question is
directly important mainly for irrigation (and impact in a minor way on
tourism by enabling or preventing certain activities, such as kayak),
and indirectly on tourism, by worsening eventual quality problems (by
increasing concentration of pollutants).
A links is performed over aggregate withdrawals,
on the one hand and feed-back of the state of the resource on the other
hand. Water consumptions evolve depending on the social context and on
the state of environment, and impact on the water resource.
The link will not be made at the same level
depending on the scale of the submodels; individual-based description on
the population allows a diversified feedback of the environmental state
on the population; finer hydrological description of the basin, may
bring to light a crisis situation which does not appear at an aggregate
level (where a positive balance is respected).
7.1.2 Original
Purpose of Model
The purpose of the model is to link water and
population dynamics, by a double link: the impact of human behaviour
(water consumption) on the resource, and the impact of the evolution (or
the state) of the resource on the evolution of the population (choice
of consumption).
In the participatory process, its purpose is to
describe the interrelations of processes in a realistic way, as a
support for discussions and for the evaluation of various scenarios
around water management in the basin. It
will also be an element of comparison with other models at different
scales (see Context).
7.1.3 How
was the Model Actually Used
It is still currently in progress.
7.1.4 Relationship
to other Models
In the series of models we will implement, we
consider hydrological models defined at two grains (different size of
sub-basins), and population models, which are individual-based and
aggregated in spatial cells. Therefore, we consider here a series of
models rather than a single one. These models are defined at different
levels of aggregation, but they share as much as possible the same
assumption in order to make relevant comparisons.
The design of the links between the individual
based and the aggregated model of population is made by considering
probability densities of agents in different states and the probability
of flow of density between the states (socio-dynamic approach).
7.2.1 Intended
interpretation
This model takes sense in a series of models. The
purpose is not to be predictive, but to compare population and water
models linked around the question of quantitative evolution of the
resource, at different scales; this is from a theoretical point of view,
in terms of behaviour of the model and precision; but also from a
participatory point of view (not totally disconnected) in terms of how
expressive it is to the stakeholders (objects and processes) and of the
playability of the model.
7.2.2 Original
Sources for Model Design
· global
modelling of hydrological processes (GR2m model) will
be used at different levels of spatial aggregation. We use this model
to simulate the evolution of the resource according to the rainfall
data. This model was developed by Cemagref and calibrated on several
sub-basins of the Orb valley
· individual
level model is used for the population based on the model general
threshold model of innovation diffusion (described by Peyton Young,
Valente, Grannoveter… among others). This model was developed by
quantitative sociologists, and happens to be easily formalised in game
theory and automata networks.
· an aggregated population model based on socio-dynamics will
be used next, it will be based on the sociodynamics theory (Elbing,
Weidlich, Haag), which uses techniques from physics (derivation of a
master equation).
7.2.3 Relations
between the model and the humans
The next figure describes the relations between
the models and its potential users.
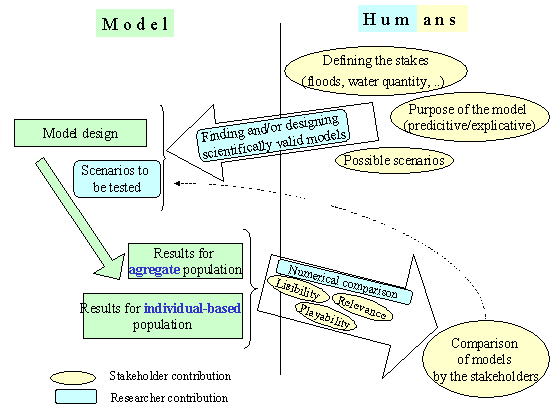
Figure 4.
Relations between the model and the humans
7.2.4 Static
Structure
The static structure of the model is synthesized
in the Figure 5.
Main items are the population, the river sub basin (flow, resource);
the link takes place through the withdrawals and environmental
indicator(s).
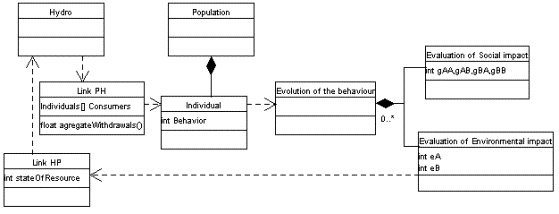
Figure 5. UML description of
the model
7.2.5 Temporal
Structure
The dynamics follow several time steps:
· month
for the evolution of water resource, which depends on previous state,
rainfalls and withdrawals
· finer
temporal scale for the social interactions and consumption behaviours ;
we model the diversity in water consumption behaviour by letting the
withdrawals vary around a mean ; the variation (under or over the mean
corresponding to respectively A or B behaviour) is the object of
decision of the individuals. This choice is to depend partly on an
individual’s social context, and on the state of the water resource, to
which each individual can be more or less sensitive: the individuals
randomly chosen to evolve, question their relationships on their
opinion, and depending on their own present one, evaluate the social and
environmental gain to maintain their kind of consumption or to change
it. Social gain is determined by the relative proportions of
relationships following one or the other of the behaviours, weighted by
parameters of the model. Environmental interest in changing consumption
is only taken into account if the environmental indicator attains a
given threshold, which may vary in the population. (This indicator is
actually represented by the mean flow over the month). The weight of the
state of the environment in the decision is proportional to the
overdraw of the indicator. The probability of choosing A is described in
the paragraph "Key Algorithms".
· For
each month, a new state of the water resource is computed. The dynamics
and interaction between the several features are voluntarily simple in
order to facilitate comparison between the different levels of representation for water and population
dynamics.
7.2.6 Important
Parameters
(a) number
of links in the social network,
(b) frequency
of interaction (in relation to the
hydrological time step),
(c) sensitivity
of individuals to social influence versus conscience of environmental
state
(d) threshold
of significance for the environmental indicator
7.2.7 Initialisation
· Parameter
fitting is used for the hydrological model, through rainfall, ETP data.
· Global statistical indicators
allow us to simulate a fictive population. More precisely, the following
features are known or estimated following the Orb case :
- Total
number of households and of farmers
- Mean
monthly consumption for a household, mean monthly water use per hectare
for irrigation, total surface of irrigated land
Parameters directly provided by the user.
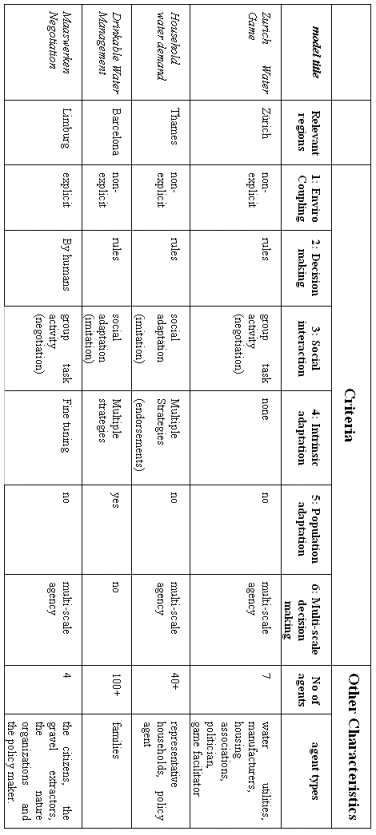
|
GENERAL
PARAMETERS
|
|
|
Parameter
|
Type
|
Remarks
|
Reference Value
|
|
P1
|
Number of
simulations
|
int
|
|
100
|
|
P2
|
Error admitted
for the results
|
float
|
(0<..<1)
|
0.05
|
|
P3
|
Name of the
river-basin
|
String
|
|
Orb
|
|
P4
|
Number of
sub-basins
|
int
|
1
|
1
|
|
P5
|
Number of
time-steps
|
Int
|
(12 * years)
|
120
|
|
P6
|
Proportion of individuals
evolving at each time step
|
float
|
|
0.1
|
|
P7
|
Kind of
evolution
|
int
|
0 : determinist
1 : probabilist
|
1
|
|
P8
|
(exponential
parameter in the probabilistic case)
|
float
|
(otherwise
ignored)
|
1
|
|
FOR EACH
SUB-BASIN
|
|
P9
|
Name of the
sub-basin
|
String
|
|
|
|
P10
|
Surface
|
float
|
|
1330
|
|
P11
|
hydro
parameter 1
|
float
|
|
400
|
|
P12
|
hydro
parameter 2
|
float
|
|
394.7513
|
|
P13
|
hydro
parameter 3
|
float
|
|
100
|
|
P14
|
hydro
parameter 4
|
Int
|
|
0
|
|
P15
|
hydro
parameter 5
|
Int
|
|
1
|
|
P16
|
hydro
parameter 6
|
String
|
File with
rainfalls and ETP
|
PETPTabarka90.txt
|
|
P17
|
Constant
monthly withdrawal
|
Float
|
|
0
|
|
P18a
|
Number of
Farmers simulated/true number of farmers
|
float
|
|
1
|
|
P18b
|
Number of
Households simulated/true number of households
|
float
|
|
7.8
|
|
P19a
|
Kind of population simulated
|
Int
|
0 :
individual-based
1 : aggregate
|
|
|
P19b
|
Number of individuals to
simulate
|
Int
|
|
10000
|
|
P20
|
Proportion of A behaviours
(sparing) simulated
|
float
|
|
0.44
|
|
P21
|
Proportion of
farmers in the simulated population
|
float
|
|
0.004
|
|
P22
|
Mean number of
farmer relationships for a farmer
|
Int
|
|
7
|
|
P23
|
Mean number of
household relationships for a households
|
Int
|
|
7
|
|
P24
|
Number of
relationships between households and farmers
|
int
|
|
|
|
P25
|
gAA for the
farmers
|
float
|
Parameters of
social influence
|
0
|
|
P26
|
gAB for the
farmers
|
float
|
|
1
|
|
P27
|
gBA for the
farmers
|
float
|
|
0
|
|
P28
|
gBB for the
farmers
|
float
|
|
1
|
|
P29
|
Weight in the
decision of the environment (farmers)
|
float
|
Parameters of
environmental influence on the decision
|
1
|
|
P30
|
Threshold of
state of resource (farmers)
|
float
|
|
4
|
|
P31
|
gAA for
households
|
float
|
|
0
|
|
P32
|
gAB for
households
|
float
|
|
1
|
|
P33
|
gBA for
households
|
float
|
|
0
|
|
P34
|
gBB for
households
|
float
|
|
1
|
|
P35
|
Weight in the
decision of the environment (households)
|
float
|
|
1
|
|
P36
|
Threshold of
state of resource (households)
|
float
|
|
4
|
Besides : two files
‘ConsoAgri’ and
‘ConsoCit’
in the main directory, provide the monthly mean
water consumption for farmers and households (in m3).
The factors of multiplication of the basic demand
corresponding to the A and B behaviours are for the moment still
directly defined in the classes Farmer (‘Fermier.java’) and Household
(‘Citadin.java’). We suppose that the multiplication factors of mean
water use, for the two behaviours are respectively 0.8 and 1.2 for the
households, and 0.1 (corresponding to very basic needs) and 1 (in case
of irrigation) for the farmers ; these numbers do not have a statistical
basis, but their purpose is to allow a first survey of the
inter-dependence of the dynamic features of the model.
The distribution around the mean number of
relationships is defined in the class generating the group of simulated
individuals (‘PopulationIndividuCentree’ (= IndividualBasedPopulation)).
7.2.8 Key
Algorithms
· Change
in consumption behaviour following social interactions (adapted from a
model studied by Peyton Young).
Individual-based model
We consider a population of individuals
characterized by their behaviour (A or B). A represents a sparing use of
water, B a non-sparing use of water.
The
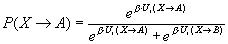
utility to go to behaviour A from a behaviour X (A or B) is expressed as
Where the gXY
are parameters of the model,
nvA is the proportion of
social relations/friends who have an A behaviour
eA is an environmental utility
which depends on the state of water resource and varies in time ; its
value varies in the following way :
for levelOfResource > criticalThreshold,
eA =0
for levelOfResource £
criticalThreshold,
eA
= a
(criticalThreshold- levelOfResource)
Conversely the utility of adopting B is expressed
in a similar way by replacing the A index by a B index in the previous
formula.
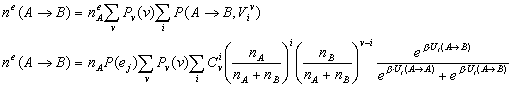
The probability for an individual of adopting A is
then expressed as a function of the utilities:
Aggregate-level model for the population
let nA
be the number of individuals of A behaviour in the considered population
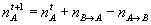
we suppose that :
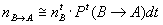
from which :

By considering
the probability of change of behaviour in the population, from the
individual-based model, we obtain for the aggregate level :
Where Viv corresponds to v
relationships out of which I follow an A behaviour.)

Supposing this population has LE links towards another population with
nA' individuals of A behaviour, and nB' , of B, the probability of
change from A to B becomes :

· Rainfall
- Outlet Flow (parameter fitted model) for the water resource.
7.2.9 Description
of Model Dynamics
Consumption evolves following discussions between
the individuals, and the level of water, thereby impacting on the
resource. The resource itself depends on the rainfall data and withdrawal
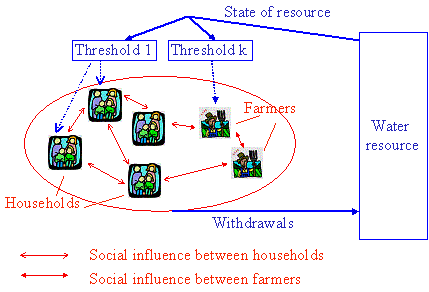
Figure 6.
Dynamics in the model
7.2.10 Implementation
details necessary to get the simulation to run but not considered
important for the results
- The
simulations are launched from the class MultiSimParam, for a few set of
parameters (one per line of the file), with the name of the parameter
file, and the numbers of the first and the last line of parameters to be
specified when called. In this case, the first element of each line of
parameters is the name of the directory which stores the results. The
directories are automatically generated.
7.2.11 Implementation Language
Java
7.2.12 Source Code
Information can be obtained from the research team
7.3.1 Example
Simulation Output
7.3.2 A mean over various simulations is
computed, as well as the bounds of a confidence interval for an error of
5%, to allow a more significant comparison between sets of parameters. Figure 7
is an example for the evolution of the sparing (A) behaviour for the
households, for a low dependence to state of resource.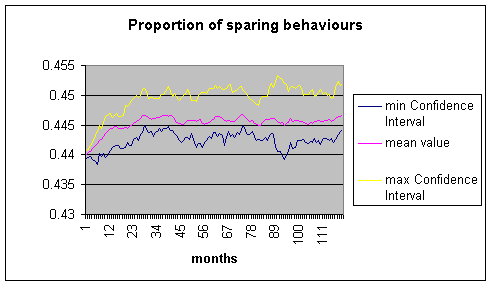
Figure 7. Proportion of A
behaviours for the households
In Figure 8.
we see two different trends for different weight of state of resource
in the decision of choice of behaviour.
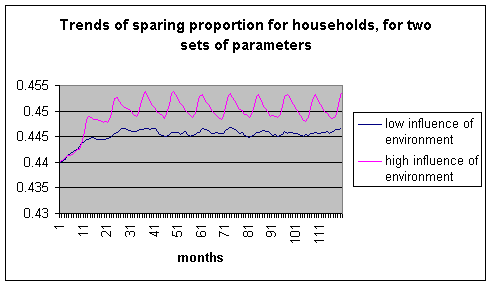
Figure 8. Trends of A (sparing)
proportion for households
7.3.3 Methodological
Lessons
The stakeholders expressed their need for models
which throw light on interactions and interdependence of processes (in
the river-basin), of different kinds and/or spatially distributed. The
way in which the results provided by the model are presented is also
important. Synthesised results and an eloquent interface (taking up
reference elements of representation for the stakeholders) are to be
favoured. (For example, realistic or symbolic maps are preferable to
abstract representations of space (such as a geometric form).
7.3.4 Future
Development
Complete different links between models of water
and population in order to determine the possible advantage of
individual-based over aggregate description of the population sub-model.
7.3.5 Published
works relevant to the model
Edwards, M.; Goreaud, F.; Barreteau, O.;
Cernesson, F.; Hill, D. - 2002. An object-oriented model linking
hydrological and social processes at an aggregate level. Présentation
orale et article dans les actes du 'Workshop Agent-Based simulation 3, special session on Simulation and Environment
' (SCS), à Passau (Allemagne), 7-9 avril 2002, 6 pp.
Olivier Barreteau, UR IRMO, Cemagref
Anne-Laure Borderelle; Flavie Cernesson, UMR 3S
Cemagref/ENGREF
8.1.1 Description
Domain Context
The model aims at representing the wine growing
practices and their consequences on the diffuse pollution in a Sub-basin
of Orb River. This takes place in a double frame:
· River
Contract of Orb Valley which aims at facilitating concerted and
balanced water management at basin scale and promotes co-ordinated
action among its members, it is managed by a basin institution “Syndicat
Mixte de la Vallée de l’Orb” (SMVO),
· an
on-going diagnosis of non-point source pollutions caused by pesticides
on a sub-basin of Orb river, the Taurou, managed by SMVO with Chamber of
Agriculture. This study aims at starting negotiations on actions to
enforce to limit such pollution because of drinking water pumping at
downstream of this sub-basin.
Following works with SMVO at the basin scale on
collective water management, identification of stakes and potential use
of agent based models to facilitate dialogue, we chose this field as an
application. We focus then on the relations between heterogeneous
localised practices for herbicide and pesticide management and presence
of undesired molecules in drinking water resource which is taken at the
downstream of this sub-basin. This sub-basin is mainly used for
wine-growing activity, which involves according to their production
patterns different kinds of pesticide uses by winegrowers.
8.1.2 Original
Purpose of Model
The original purpose of the model is to study the
possibility of using an Agent-Based Model to facilitate the discussion
within such an on-going negotiation process. The model is supposed to be
helpful in the discussion about scenarios of action: for the
elaboration of possible scenarios, and the discussion about the decision
to adopt one or the other.
From a methodological viewpoint, we have chosen to
built the model through a dialogue with key stakeholders. Such
“co-building” has got three main goals:
· reaching
models which are not too far from local stakeholders languages in terms
of environmental and socio-economic indicators as well as in terms of
scales,
· specify
features of interface to prevent misuses,
· increasing
the probability of use of the model.
8.1.3 How
was the Model Actually Used
The implementation is currently in progress by
nature of the design process. Three versions of this model has already
been implemented. They have been used in two different settings:
· in
scheduled meetings with the key stakeholders involved in the
participatory model design for the three of them: they have commented
each version, proposed modifications and asked for specific features;
· with
institutions involved in the diagnosis study for the first version so
that they might understand what kind of models it is a matter of, as
well as they might comment main assumptions.
8.1.4 Relationship
to other Models
There is only a weak link with a few physical
model for transfer and decay of pesticides molecules according to plot
borders nature (ditch, hedge…) and topographical characteristics (slope,
direction of vine rows according to slope). Algorithms used to specify
chemicals behavioural patterns are derived from “classic” physical
models and validated through a comparison with them.
8.2.1 Intended
interpretation
This model is intended to make people discuss on
collective use of pesticides and their impacts on drinking water quality
downstream. This means that it should have corresponding elements which
entails stakeholders to discuss about their real basin on the basis of
simulations on the virtual basin which constitutes the model. However
this correspondence must not be to precise at the finer grain in order
discussions go towards shared processes and eventually common rules
instead of individual consequences. Therefore we’ve gone towards an
archetypal basin with correspondence elements dealing with:
· diffusion
process of chemicals,
· overall
layout of basin,
· classification
of chemical use practices.
8.2.2 Original
Sources for Model Design
Physical patterns of the model are based on
simplification of existing models from literature validated through
interviews of experts. This deals notably with transfer of pesticides
and distributed modelling of hydrological processes.
Space representations are based on original field
work for description of the four various kinds of landscapes in Taurou
sub-basin. Three places have been randomly chosen and analysed in each
kind of landscape for five items:
· size
of plots,
· soil
use (and notably rate of plots with grass or forest instead of vine),
· width
of inter-plot borders,
· kind
of inter-plot borders among five categories: track, ploughed, grass,
hedge, ditch,
· kind
of practice for weed management (on rows or in-between rows).
This entails to describe typical space composition
of each kind of landscape.
Thus practices are based on Chamber of Agriculture
reports as well as on these field observations. They are described
according to the place pesticides are put in plots and the amount of
pesticides which is put according to rates recommended by pesticides
sellers:
· on
rows or in-between rows,
· organic,
conventional (full use) or limited use (one third of recommended
amount).
They have been validated through interviews of a
sample of farmers in the sub-basin.
Relations between models and humans
One of main features of this experiment is the
choice of a co-design of the model with some key stakeholders, who are
potential users of that kind of tools. More than advertising for this
kind of model, it is more a question of increasing their awareness on
what can be done and not done with these models. This is a way to tackle
validation issue: valid use domain of these models is supposed to be
better grasped by stakeholders who have participated in their design.
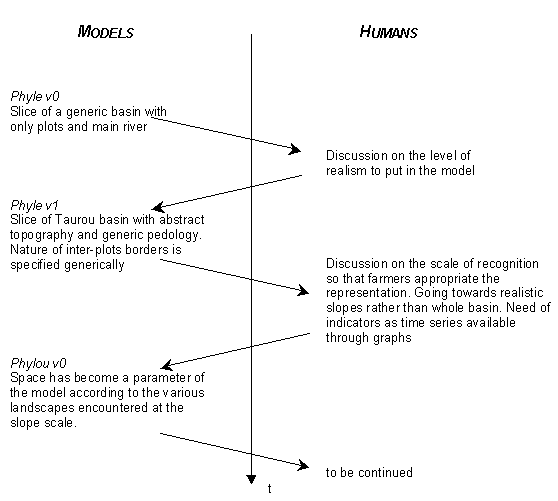
There have been three main steps which are summed
up in following Figure 9.
Figure 9: Interactions among models and humans in the
Phyle/Phylou process
8.2.3 Static
Structure
In the current state, Phylou0 is mostly dealing
with reactive entities. They are described by UML class diagram in Figure 10.
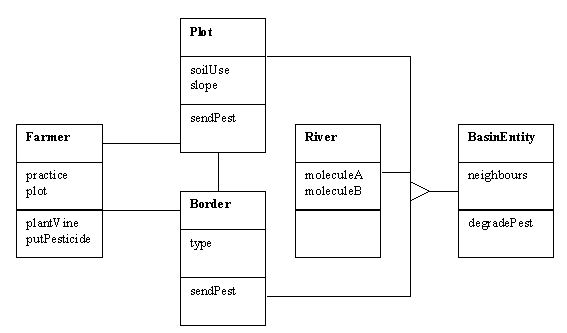
Figure 10: UML class diagram of
Phylou with main classes used in the model
This diagram presents the additions of Phylou on
top of Cormas platform. Each space entity inherits from
AggregatedSpaceEntity class of Cormas. Space representation in Cormas is
composed of cells as a Cellular Automaton (Bousquet et al., 1998).
8.2.4 Temporal
Structure
Three main time steps are considered:
- cropping
season corresponds to the whole simulation length, landscape and
plantations are considered fixed at this time scale,
- day
is time step for action of farmers, to choose to put chemicals or not.
- smallest
time step is 6 seconds for the dynamics of chemicals and water from one
cell to another.
In any case, each farmer who puts pesticide on his
plot makes two supplies to his plot, on short time stages given for all
farmers. Farmers who puts a little pesticide choose time of bringing
according to the rain while not farmers with full supply.
Rain is given according to a real time series of
rain in the area (rains of 1995). It is the engine of transfer but is
considered as external and fixed for all simulations.
8.2.5 Important
Parameters
In current version, two main categories of
parameters are key to understand the overall behaviour if the system.
They are those on which we make the sensitivity analysis.
First farmers’ practices are determining the
overall amount of pesticide supplied in slopes. This determines the
input in the system which then might be transferred to the river or
degraded in plots or borders.
Second, space pattern is allowing or blocking the
access of pesticides to the river. Rates and space organisation of
various soils occupation for plots and borders (respecting the observed
proportions for plots) and of types of farmers constitutes different
space patterns which are simulated.
Choice of whole space scale has been one of main
results of the interaction process with stakeholders. Figure
11
presents the various space scale which are relevant to a basin approach.
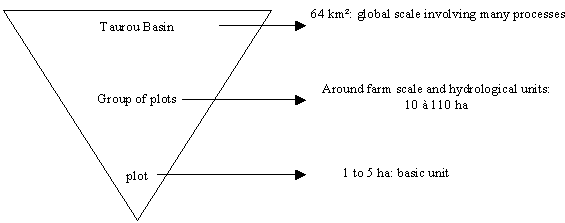
Figure 11: panorama of relevant
scales for basin study in Taurou valley
Meetings with stakeholders have lead to choose
group of plots or slope as the main space scale, to be recognised by
farmers and on which test scenarios of space patterns. Finer grain has
to stay archetypal. Larger grain, whole basin, is beyond scope of the
model in its current version and is going to be either on manager’s role
or in a new version a composition of current scale, not necessarily
with same architecture.
8.2.6 Initialisation
Initialisation deals mainly with the constitution
of the landscape pattern to simulate and loading of rain file.
8.2.7 Key
Algorithms
Pesticides are described with their rate of decay
and solubility. Main process is following a rain event the transfer of
remaining pesticides in plots to the ditches network and then the river.
Table 1 explains the transfer according to various possible soil use.
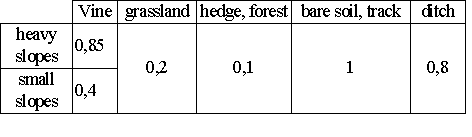
Table 3: transfer rates
according to soil use
8.2.8 Description
of Model Dynamics
After each rain event provided by rain file on a
daily basis, the “6 seconds” time steps is activated until all water has
been drained to the ditch network or the river. It simulates this
draining of the rain on the landscape taking along some of the
pesticides located on plots at the moment of drainage.
Otherwise the time step is the day for rain file
activation as well as for choice of pesticide supply by farmers, during
the time slots fixed in the model.
8.2.9 Implementation
details necessary to get the simulation to run but not considered
important for the results
Landscapes patterns are stored in map files. They
are created apart from the simulation in a raster format.
8.2.10 Implementation
Language
We used SmallTalk on top of Cormas platform
8.2.11 Source
Code
Information may be obtained from the research team
as code files. Cormas and VisualWorks’ SmallTalk are required to run it.
They can be downloaded from Cormas website: http://cormas.cirad.fr
8.3.1 Example
Simulation Output
First output of simulation is the evolution of
presence of pesticides in plots with time. They disappear progressively
with time and move towards downstream after rain events. Figure
12
is featuring this part of interface for depression landscape.
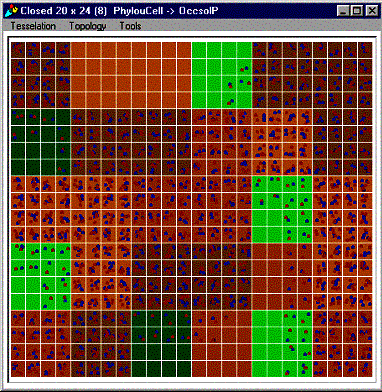
Figure 12: presence of
pesticides on the plots in a depression landscape after 80 days (each
red and blue point is featuring a fixed amount of two different
molecules simulated)
Simulations are providing time series of presence
of pesticides at downstream point of each landscape simulated. Figure 13
is presenting such output for various rates of ditches among borders.
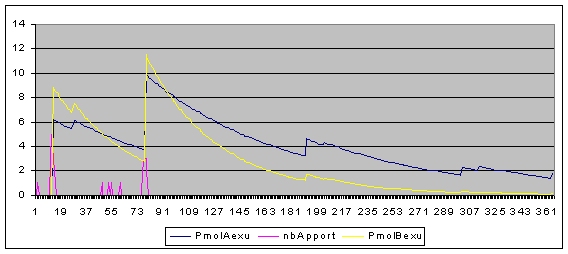
Figure 13: simulations of
amount of two kinds of pesticides at the outlet in a depression
landscape (in pink are number of farmers supplying pesticides each day)
8.3.2 Results
claimed as significant
First results on simulations seems to show a
threshold effect of rate of ditches among borders. If there are more
than some 30% of borders as ditches then pesticides go in big amount in
river while if it is less than 30% a few pesticides go to the river.
Validation has still to be done but this non linearity of the response
is an interesting result.
8.3.3 Methodological
Lessons
Co-design of model entails reaching interesting
models which may be used to simulate scenarios. They facilitate the
choice of a right scale for representation.
8.3.4 Future
Development
The process is going on with the co-design process
with major stakeholders up to the point of diffusion to resource users.
Simulation of scenarios on communication among
farmers and sensitivity analysis is next step to understand the effect
of social processes within various landscapes patterns.
8.3.5 Published
works relevant to the model
Borderelle A.-L. (2002). Eléments pour une
modélisation théorique destinée au partage de connaissance. Exemple de
l’utilisation des produitsphytosanitaires en viticulture sur la
ressource en eau. Mémoire de DEA, ENGREF/Université de Montpellier 2,
Montpellier.
Joerg Krywko; Pieter Valkering, Jan Rotmans, Anne
van der Veen, ICIS
Description Domain Context
The model tries to reflect on a negotiation
situation related to planning efforts in the Maaswerken project. The
large-scale infrastructure project was started in 1997 to integrate two
main projects ''Grensmaas'' and ''Zandmaas/Maasroute'' with the problems
of flood protection after the two severe floods of 1993 and 1995. The
foundation of the Maaswerken project as well as the Maaswerken
organisation was intended to cope with the complexity of problems and
issues, and the plurality of stakeholder interests in the planning
region. The course of the project has been changed, since planning
began in the early 1990's without taking the thread of possible floods
in account. Yet, the main criteria of the project are:
1) improvement of
flood control,
2) development of new
nature areas,
3) improvement of the
navigation infrastructure on the Zandmaas and Juliana canal,
4) gravel extraction
The planned measures to achieve these goals are:
Deepening and broadening the summer bed of the
river, lowering the flood plains, creating new side canals (in the
winter bed), building embankments and renew the sluices. This entails a
fifth criteria:
5) hindrance during
the execution period of the project
The planning procedure consists of the submission
of planning proposals by the Maaswerken organisation, the objection by
the public, and the repetition of both processes until a compromise is
found. The latter process is main subject of the (ABM) modelling
endeavour. An elaborate description of the domain context is available
in the Maastricht part of the WP2 document.
The purpose of the (coupled) integrated assessment
model and agent-based model is not to predict processes in a real world
example as the Maaswerken. However, due to a shift from mono-centric
decision making to a polycentric understanding of policy making in water
management there is a higher demand of incorporating stakeholder
positions in planning procedures. Therefore, the model is an attempt to
incorporate social dimensions like stakeholder interests, goals and
pluralism in terms of a variety of stakeholder perspectives. Furthermore
these dimensions are supposed to be modelled in a way to simulate
negotiations between various stakeholders in form of agents. There are
three main objectives:
1. Analyse and
reconstruct the course of the Maaswerken project on an organisation
level. In other words we try to find a way to describe the negotiations
between organisations that represent stakeholder interests in form of an
agent-based computer model.
2. Explore possible
future "pathways'' of the Maaswerken. Which planning strategies are most
sustainable, and what are the (long-term) consequences on the
environment as well as on the agents (stakeholders) within the target
system?
3. Identify robust
strategies taking in account the most significant uncertainties and
stakeholder perspectives. Both are highly inter-connected since every
individual or organisation has its own view (belief) on how the world
works. The incorporation of both landuse scenarios and climate change
scenarios within simulations help to identify uncertainties stemming
from physical processes of the environment.
The model was used to describe the planning
processes of the Grensmaas project by entering 5 different "real world''
planning approaches (''Groen voor Grind'', ''Maasvarianten 1-3'' and
the most recent proposal by the province of Limburg). The planning
proposals have been generalised to strategies consisting of a set of
measures in relation to a cross section. The cross section itself has
been generalised from a two-dimensional model indicating measures on
various locations along the river. In the beginning the model was used
to test the sensitivity of the physical environment to the impact of
planning strategies.
The model is basically tailored to the needs of
water managers who want to decide on a set of measures, forecasting the
impact of these measures on the environment as well as on the goals and
needs of various stakeholders.
The model can be used as a communication support
during a negotiation. Stakeholders are modeled as independent and
cognitive computer agents, and they are at the same time enabled to
manipulate model parameters related to their own goals and beliefs.
After each simulation run stakeholders may monitor the results and see
the consequences of their actions, respectively their reactions.
The targeted users are water managers and decision
makers on one hand, and involved organisations and institutions like
citizen groups, municipalities, NGOs and Farmer organisations, who have
been consulted during a serious of interviews on the other hand.
The impact of planned changes on the environment
can be tested by help of a local example in form of a cross section.
This helps to understand the model relations between agents and the
environment as well as possible feedbacks of human impact on the
environment.
The physical model in its current phase has the
capability to calculate dynamics of the physical environment. All
modules and their relationships are newly designed. The ABM design is
based upon real world observations (planning documentation of the
Maaswerken organisation) and concepts from social psychology (Conte
& Castelfranci, 1995), conflict and attitude research in sociology.
The physical models are based upon known
mathematical models.
Intended interpretation
The model has a descriptive character. It is
supposed to reflect the planning procedure of the Maaswerken project. In
principle, this consists of interactions between a policy maker
proposing planning strategies and other stakeholders (in the model both
are represented as agents), evaluating the proposed strategy, and
displaying agreement or disagreement (see Figure 14).
Figure 14. Negotiation scheme
of Maaswerken agents
The agent policy maker is able to propose plans
that suggest a set of measures (strategy) that change the environment.
Therefore, this agent is able to perceive the current environment (state
(0)), and perceive the respond of other agents. Based upon this
information the agent 'policy maker' creates a strategy, that may lead
to a new state of the environment. The magnitude of impacts of these
measures can be calculated by the integrated assessment model. The
results are perceived by the other agents. The respond will be reported
to the policy maker agent. This process will be repeated until a
compromise is found (see Figure 15).
Figure 15. Finding a consensus
strategy
The Integrated assessment model is able to
calculate the impact of the planning strategies on the environment.
Agents in the model represent stakeholders in the
real world. More specific, agents represent stakeholder organisations.
The emergence of these organisations from single individuals has been
observed, and is now assumption for further modelling.
The agent architecture is based upon concepts
originating from concepts of social psychology. The objectives of
organisations and their knowledge (belief) is modelled by help of the
symbolic representation 'goals' and 'beliefs' (see Figure
16).
Figure 16. Agent architecture
In the model the agent system comprises four
stakeholders. These are: 1) the citizens, 2) the gravel extractors, 3)
the nature organizations and 4) the policy maker. These agents act on
the basis of five indicators from the physical environment: 1) the
recurrence time of floods, 2) the monetary costs, 3) the area of nature,
4) the amount of hindrance, and 5) the amount of extracted gravel.
The criteria are identical with goals and can be
expressed in quantitative values. Thresholds indicate whether or not an
agent agrees with a planned measure. Threshold values can be displayed
by help of satisfaction level curves indicating minimum and maximum
values as well as the 'negotiable' values.
Priorities among goals help each agent to display
an overall assessment relating to all interesting criteria. A system of
weights helps to set priorities and come to an overall assessment.
Besides the agent architecture Figure
16
shows the interface of the agent module to the integrated assessment
module and the user interface (see Figure 17)
as well as the data flow between them. The difference between the two
agent types is best described by the use of the model. The policy maker
is enabled to modify the strategy class.
Figure 17. User Interface
The user interface enables the stakeholders to
insert their own parameters, and displays results that can be
interpreted as consequences of an implemented strategy. Own beliefs of
stakeholders in form of cost parameters are included within each
calculation.
The actions and reactions of agents are
represented as 'history' (the memory of former actions in a table).
After a number of proposals, each stakeholder may change values of
elements of the symbolic representation. This can be part of a
participatory group meeting.
The interaction and communication between agents
is modelled by a communication protocol (e.g. the number of action
proposals is determined as well as the number of sequences of
proposals). The aim is to achieve a 'master plan' of changing the nature
without violating principle goals of (stakeholder) agents, as well as
achieving a ustainable state of the environment.
In the prototype model the environment is
represented by a river cross section (see Figure 18)
with a standard length of 500 m. This way the planned changes
(strategies) on the environment can be modelled in a simplified way.
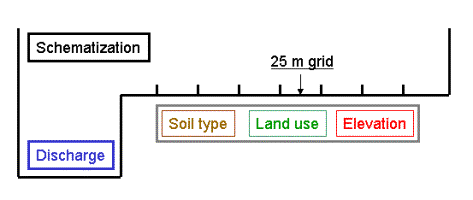
Figure 18. Cross section
The physical model consists of a number of modules
and their relations.
The 'load strategy' module
corresponds with a planning proposal. It is capable to update those
files describing the environment (hydraulic schematisation, river
sections, DEM, soil and land use files). The module contains 8 numbers
representing following measures:
· Summer
bed deepening (m)
· Summer
bed broadening (25 m units)
· Winter
bed deepening (m)
· Winter
bed broadening (25 m units)
· Raising
of dikes (m)
· The
option between:
· Storage
outside the region after cleaning (1)
· Clay
storage within the area in a clay shield (2)
· The
starting point of the clay shield (25 m units),
· The
width of the area along the river that is allocated to nature (25 m
units).
Three primary aspects of the discharge pattern can
be calculated with the Rainfall-Runoff module:
1) the recurrence times of extremely high
discharge (Gumble analysis and the conditional peak method),
2) the exceeding times of regular discharges, and
3) the average spring discharge.
The hydraulics module calculates
the relation between the discharge and water level. The only input to
the module is the schematisation file to represent the river
cross-section.
The groundwater module calculates
the groundwater table along the river on the basis of the average spring
discharge calculated with the rainfall-runoff module and of the soil
characteristics of the adjacent land.
The inundation module calculates
the inundation duration for each grid cell. The critical height where
flooding occurs is in principle equal to the elevation of the grid cell.
The flood risk is calculated as
follows:
· The
''critical'' height of which flooding occurs is determined. In general,
this will be the height of the grid cell of land use type "inhabited
area'' closest to the river, possibly raised with the height of the
protecting dikes, as specified by the elevation file. If no inhabited
area exists, the module takes the elevation of the bank of the winter
bed as the critical height. When no winter bed has been created, it
takes the elevation of the bank of the main channel.
· The
"critical discharge'' corresponding to this "critical height'' is
determined from the discharge water level relation produced by the
hydraulics module.
· The
frequency of occurrence of the "critical discharge'' is determined from
the recurrence times of extreme discharges produced by the inflow
module. The recurrence time of floods is specified in years.
The flood damage module calculates
total monetary damage as a result of flooding for floods of different
recurrence times. This is done on the basis of the damage functions and
maximum economic values (EURO/ha) of different land use types found in
(V&W, 1999)
The nature module simply
calculates the area of nature by summing all the grid cell of land use
type "nature' This number is multiplied with the cross-section length
and the length of a grid cell, so that the result is specified in m2.
The costs module calculates the
extracted volumes and the cost and benefits on the basis of the three
soil files: before measures, after measures excluding clay shield
construction, after measures including clay shield construction.
Hindrance is calculated as follows.
The module scans the grid for cells with land use type "inhabited area''
(code 50). For each of these grid cells the hindrance is calculated by
summing "sub hindrances'' over a surrounding length of 20 grid cells
(10 in the direction towards the river, 10 in the direction away from
the river). When the surrounding length overlaps with the river or with
the other area boundary, the surrounding length is automatically
shortened to fit within the region. The "sub hindrances'' equal the
total volume of extracted material, multiplied with the two constants:
1) the number of people in each "inhabited'' grid cell, and 2) the
total number of days of extraction is needed to extracted 1 m3
of material. The "sub hindrances'' are weighted with the value of the
distance between the grid cell of inhabited area and extraction. The
total hindrance is calculated by summing the hindrances of all grid
cells of land use "inhabited area''.
The number of agents is constant. If this number
must change, the model has to be expanded by a new instance of class
agent. Emerging agents or group agent are not programmed. The agent
architecture is in principle static. Each agent has goals, beliefs
(symbolic representation) and an action plan.
The communication structure between the agent is
static (see Figure 14).
The interaction protocol determines how the agents interact with each
other. The interface between the agent-based model and the integrated
assessment model is static as well as the user interface.
The values of parameters determining thresholds
(of each agent) are variable and may change under conditions. This may
be changed by stakeholders. Belief parameters can be changed in the same
way. An agent may also choose between different methods in calculating
environmental parameters. Reasons for changing methods, however, have
to be predefined, and may also change under conditions.
In a planned version of a simulation model under
changing climate and land use condition, the dimensions of the
environment can be dynamic.
Important parameters can be expressed in the
"strategy" or planned measures:
Summer bed deepening/broadening, winter bed
deepening/broadening determine the parameters determining the riverbed
geometry. These measures, as well as raising of dikes, establishing an
area devoted to nature and clay storage correspondent with the so-called
"belief" parameters of an agent. An agent wants to change the world
according to his own ideas, for individual reasons. Therefore the
variety of these parameters express different perspectives on the world.
Another set of important parameters is goals,
expressed in threshold values. Besides the priorities these parameters
determine the acceptance of proposed strategies. Every agent is able to
compare parameters from its own set of goals with the parameters of a
proposed strategy. This way the agent is can react with "no", if the
lower limit is not reached, with "to be negotiated", if the proposed
value is higher than the minimum value, but lower than the maximum
value, and "yes" if the maximum value is reached. The maximum value in
fact means that a minimum value is reached for an unconditioned
agreement.
Priorities of an agent determine the order of
goals of an agent.
A simulation is being started by an initial
strategy that is inserted by the policy maker. This is taken from the
Maaswerken reports. The relations of measures of real world data are
reference for relations in the modelled target system. The sequence of
the strategies is determined by the applied communication strategy.
The implementation language is C++. A more recent
agent module is currently being programmed in Java.
The source codes can be downloaded from
ftp://exchange@ftp.icis.unimaas.nl/Firma/
password: icis
The model
consistant of an agent module, an environmental module and a user
interface is able to display the consequences of the impact on the
environment in combination with various
beliefs and goals of stakeholders. The latter fact is possible due to
independently working agents who observe the same measures on the
environment, however, reseive different results. This is only possible,
because of incorporating the agent's individual symbolic representation
in the simulation.
Planners and decision makers are able to see the
consequences of their planning strategies not only on the environment,
but also on the interests and goals of involved stakeholders. The
interface serves as comunication tool for a stakeholder meeting. The
advantage of this model approach is a quick test of a number of
strategies that can be discussed within a time period of a stakeholder
meeting. Decision makers are able to reconsider planning strategies,
stakeholders are able to reconsider their own beliefs and goals, based
upon an integrative modelling strategy.
9.12.1 Example
Simulation Output
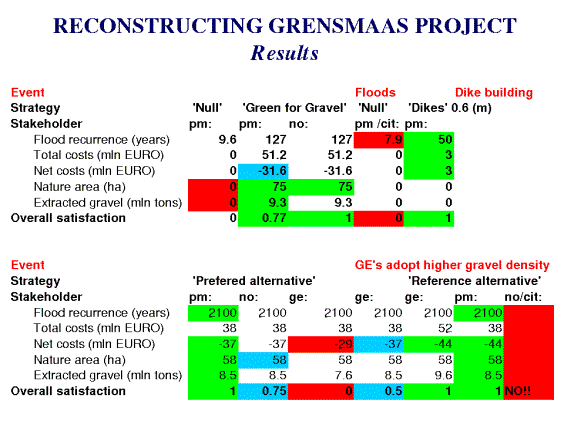
Figure 19. Example simulation
output
Figure 19
displays results based upon two different events. The first part shows a
strategy with a low safety level. The agents 'citizens' and 'policy
maker' disagree with the strategy because of a low safety level.
(overall satisfaction 0). The second part shows a higher belief
parameter 'gravel density' adopted by gravel extractors. This strategy
is still declined by gravel extractors because of the high net costs.
A target system like the Maaswerken project
requires a simplified prototype model to detect in principle model
relations on one hand and the complexity on the other.
Using concepts origin from social psychology
appears to be an appropriate way to simulate communication between
cognitive agents. However, applying these methods entails a high degree
of uncertainty. For example, assuming organisations act based upon
rational decision making is reasonable in theory. However, irrational
elements in decision processes can not entirely excluded. The modeller
has to take in account non-linearity of decision processes, which can
not be modelled at the moment.
The model will primarily be used by water
managers. The aim is to support planning processes by adding
perspectives of various stakeholders to the model. This way the
consequences of actions on the nature as well as on other agents can be
made explicit.
A final validation discussion still has to be
performed, to tailor the model to the specific requirements of the
modelled stakeholders.
In the moment the model is based upon a
simplification of agents as well as on a simplification of the
environment. This entails unavoidably scaling problems. Measures taken
upon the environment take place on various location along the river,
with mostly local impact on residents and nature. This must be improved
in a further developed model. The environment has to be modelled two
dimensional to give way for implementing specific measures.
Simultaneously, the number and the specification of agent has to be
increased.
Hoever, the overall approach shows a way to avoid
a mere 'engineering solution', enabeling collaborative planning
approaches.
The model should, furthermore, encourage people to
participate a discussion about a project without a specific knowledge of
engineering or planning procedures. It should also give the user
insights to consequences of the impact on nature and possible reaction
of other stakeholders as well as limitations emerging from a negotiation
process.
Conte,
Rosaria, and Cristiano Castelfranchi (1995) Cognitive and social
action. UCL Press limited. London. 215p. ISBN 1-85728-186-1
Krywkow,J., Pieter Valkering, Anne van der Veen,
Jan Rotmans (2002) Coupling an Agent-Based Model With an Integrated
Assessment Model to Investigate Social
Aspects of Water Management. In: Christoph Urban (Editor) Workshop
2002: Agent-Based Simulation 3, Proceedings, SCS-European Publishing House, Erlangen, Ghent 2002 ISBN 3-936150-17-6
http://www.or.uni-passau.de/workshop2002
Krywkow, J., Pieter Valkering, Jan Rotmans, Anne
van der Veen (2002) Agent-based and Integrated Assessment Modelling for
Incorporating Social Dynamics in the Management of the Meuse in the
Dutch Province of Limburg. In: Rizzoli, A.E., A.J.Jakeman (Eds.)
Integrated Assessment and Decision Support Proceedings of the First
Biennial Meeting of the International Environmental Modelling and
Software Society, vol.2, p 263 - 268. IEMSs 2002, 24 -27 June 2002,
University of Lugano, Switzerland. ISBN: 88-900787-0-7.
http://www.iemss.org/iemss2002/proceedings
Valkering, P. (2002) Prototype 3. Working paper
ICIS.(in press)
Adolfo López-Paredes, University of Valloid
David Sauri, Universitat Autonoma de Barcelona
The main
objective of this project is the development and the application of
agent based models integrating physical, hydrological, social and
economic aspects for the improvement of drinkable water resource
management.
To make
it possible we have designed a model that integrates different modules. Inside these modules we find the consumers, municipalities,
institutions, the companies and the climate. The modular structure has
the advantage of allowing us to develop the different submodels of the
system (social, climatic, economic...) in an autonomous way and
presenting different levels of disaggregation. Each one of them is a
model formed by agents and integrated in a superior range entity that
facilitates the mutual interactions of the participants of the system.
Methodologically,
we have used agent based modelling to develop the model. The model has
been designed to enable the micro-definition of the agent’s behaviour at
level of the individual but with the final objective to understand
global societal phenomena. That is, the aim
to understand the emergence of macro behaviours resulting from
micro-level interactions.
This
model's purpose is to build a tool that allows us to study and to test
the effects of alternative policies and strategies of water management
in the Metropolitan Region of Barcelona. These
policies can be oriented toward supply policies and/or demand policies.
From the point of view of the demand, we compare different strategies of
prices. From the point of view of the supply we evaluate different
infrastructure policies.
It is
interesting to analyse the effect of these policies with different
weather conditions, different sequences of precipitation and
temperatures in the region. So we can distinguish the influence of
environment in evaluating those policies.
The
model has been implemented with two languages. The SDML version has been
intended to create the structure and check the results of simulations
at low scale. The Java version has been realized with the SDML
structure, but a greater scale, close to the real system we are
studying. Currently we are working in calibrating the parameters of the
Java version.
The
growth of the metropolitan region is inspired in the Schelling model of
spatial organisation of cities. The evapotranspiration concept employed
in the SDML model of Thames Region has been performed for the Barcelona
Region.
The
model is intended to facilitate discussion between stakeholders. The
program is designed to run the simulations in an interactive mode. So,
stakeholders can introduce their preferred strategies to compare the
effects on the global system. The model can not be used as a forecasting
tool and discussion should address the dynamics of different management
policies.
We
developed the core model from the stakeholders’ beliefs on water
consumption. Some modules in the model has been designed from other
models: the works of Benenson and Schelling on population distribution,
and the market’s model of Galan.
The model has been
built on different submodels. These submodels interact with each other
and with the user.
The different modules that compose the system are the following ones:
Social Module:
In this module the families perform their social behaviour, the
processes of birth, growth, emancipation and death of the family
members, the immigration process into the region, and the process of the
individuals' decision to move house.
Territorial Module:
This module deals with the initialisation of the different
municipalities, of the distribution of their houses and of their
expansion through time.
Climate Module:
This is in charge of collecting the data of precipitation and
temperatures introduced monthly in an exogenous way to the system, for
access by the other elements of the system.
Water Demand Module:
This is the module responsible for obtaining the desired demand of each
family and of determining the real consumption of each one of the water
consumer agents in the model, to build the aggregated demand of
drinkable water.
Infrastructures
Module: Module in charge of holding and updating the group of
infrastructures of the region during the simulation.
Supply Module:
This module obtains the information from the climatic module and the
module of infrastructures in order to determine the regional supply
water.
Stakeholder Module:
This module includes the rest of the agents or institutions that
participate or have influence in the water process. Here there are
agents like Municipalities, Generalitat, and water companies. These
agents are modelled by means of the price strategy and the
infrastructure policy.
Emergency flag:
This is a simple bit that is active when there are problems in
satisfying the demand of water with the available supply at a given
moment. Its state influences the agents’ consumption decisions.
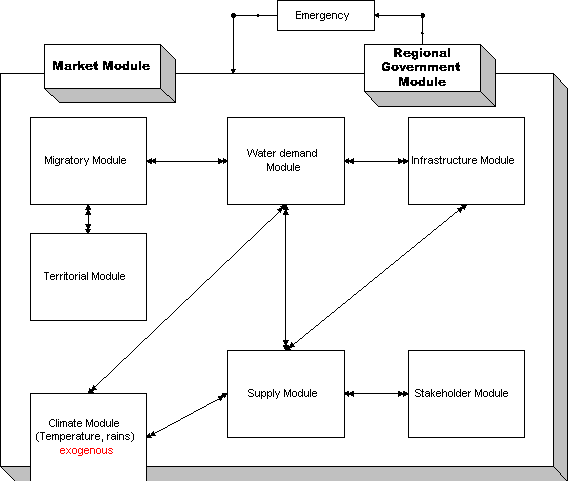
Figure 20. General
diagram of the model.
There is a list of
initial parameters whose values should be carefully addressed to avoid
abnormal results in simulation. These are explained in the appendix 1.
Once all
the parameters are fulfilled
and we start the simulation, the initialisation stage of the model
states:
1. The first thing that takes place in the simulation once the
execution begins is the creation of an instance of the climate module.
This instance holds the list of precipitation and temperatures of every
month along the whole simulation. These data are provided with two ASCII
files called Temperatures.txt and Rains.txt and they are kept in memory
by means of two lists to be requested by the simulation when some
object needs them. The climate module controls this step.
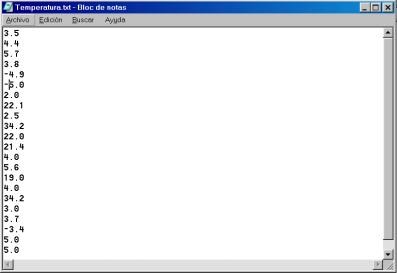
Figure 21. Text
file to introduce temperatures of every month.
2. When the data of the climate have been loaded in memory, the
program reads the variables worldXsize and worldYsize
that determine the window corresponding to the geographical area of
study (Territorial Module).
2.1. A reticular surface to hold an object in each of their
places. It will be in charge of holding the houses of the municipalities
of the region.
2.2. Two reticular surfaces of the same size as the previous one
and they will take charge of holding values, one will hold the demand in
each place and the other one the predominant social class.
3. After this, the following step is the construction of each
one of the municipalities according to the values that we have defined
in the configuration windows. In order to construct it, the simulation
reserves the defined space of each municipality in the grid
(reticular surface) and begins to build their houses. (Territorial
Module)
3.1. The initial construction of the houses of each municipality
is done through going all over each one of the cells that belong
to the surface define by the coordinates x1, x2, x3 and x4 and creating
in each cell a house type according to the percentages probSemiDetached,
probFlat y probUnifamiliar defined in the parameters
of each Municipality. This way, the initial configuration of houses of
each municipality is obtained, formed by flats, semi-detached houses,
detached houses or unbuilt zones.
3.1.1. Each one of these constructions has their own variables that
characterize it, such as their situation in the grid,
the maximum number of families that can inhabit it, a list of current
family locations, their price or the housing type.
3.2. After the simulation has created the houses, it builds the
initial number of families in each municipality. These families are
created with random internal variables according to the parameters
defined in the configuration windows FamilyParams and
the characteristics of each Municipality.
3.3. When the program already has the initial number of families
that has been defined, the following step is to allocate houses for
those families. In this distribution process, each family chooses, in
turn, a house. If the family has enough wealth to buy it and if there is
available place, the family buys the house and begins to live there. If
not, the family repeats the process until it finds a place to live. If
after a high number of attempts (2000) a family has not found a house,
then it becomes part of the families that rent a house in the
municipality, and it will try to move up to owning a house in the future.
4. The particular supply is created; the group of
infrastructures that hold the supply of water in the whole region. This,
in turn, creates the instances of desalination plants
and reservoirs (defined in Supply Window) in the
region. In addition, the simulation introduces
specific water leaks that appear because the use of the net and because
different dissipater effects, WaterLeak.
(Infrastructure Module).
4.1. The reservoirs are characterized by their cost, their maximum
capacity, their surface, and by the cubic meters that are contained in a
certain period of time.
4.2. The desalination plants are characterized by their cost and
by the cubic meters of water that they are capable of desalinating over
a period of time.
4.3. The number of desalination plants and of reservoirs can be
changed at any given moment during the course of the simulation.
5. Lastly a specific price policy is created, PolicyPrice.
This remains in memory to be consulted by any object of the simulation
at any time. This policy can be changed during the course the simulation
through use of the configuration window. (Stakeholder Module)
The migration processes.
Computing water price.
Computing familiar
water demand.
We
differentiate two time levels in the model: month and year. Agents act
at these time levels:
Monthly events:
1. The temperature and precipitation values. (Climate Module).
2. The reservoirs store a percentage of the precipitation
depending on their surface and maximum capacity. (Infrastructures
Module). Desalination plants provide a quantity of available water.
(Supply Module). The program calculates the losses in the water net and
they are discounted from the water supply. At the end of this the
available water in this period is known. (Supply Module).
3. The social module that contains the migration module is
executed. This step includes the social development of the families,
immigration and moving (Social Module). When families decide to move,
their decision is affected by: price, social class and family size, as
follows.
Price. We define the neighbourhood of a family’s house as the
collection of the houses that are adjacent to it. The family calculates
the mean house price of such a neighbourhood using the Equation
1. The simulation calculates the price of the neighbourhood of the
three candidate houses and of their own home in this way. To normalize
the data, all of them are divided by the highest price and multiplied by
the weight with which each family values this first effect. In this way
the simulation obtains the first factor that allows the valuation of
each house by a family.
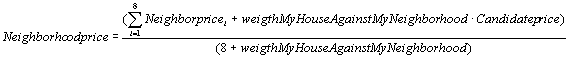
Equation 1
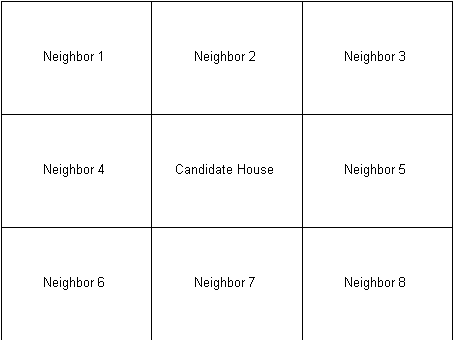
Figure 22. Diagram of a
neighbourhood.
Social class. The second factor to value a candidate house is the number
of people of the same social class that inhabit in the neighbourhood of
the candidate house. To make it, each family finds the percentage of
families of the same social class in the neighbourhood of each house,
and all these data are normalized in similar way to the previous step.
This it is the second criterion that allows valuing the suitability of
the houses.

Equation 2
Family size. Depending on the number of members that are
members of a family in a given moment, each family will have a
preference for a house type or another according to the Table 1. After a family has
pondered the preference, the simulation works as in the previous cases,
divides by the highest number to normalize and multiplies by the factor
of influence of this effect on this particular family.
|
Family
size
|
3
|
2
|
1
|
|
1-3
|
Flat
|
Semi-Detached House
|
Detached House
|
|
4-5
|
Semi-Detached House
|
Detached House
|
Flat
|
|
> 5
|
Detached House
|
Semi-Detached House
|
Flat
|
Table 4.
Preference for house type according to number of members in the family.
Once each family has quantified the three influence factors
relating to moving, it chooses the suitable house according to the Equation 3.

Equation 3
Where
·  is the value of the i-house for a family.
·  are the weights different that each family gives
to the different effects.
are the weights different that each family gives
to the different effects.
· effects are
the normalized values of each candidate house.
The birth of new members in the family. Depending on the cycle of family life, there is a certain
possibility that a family has a new member. This probability is more
intense in the first ten years of life of a family, a little lower until
the twenty years, and impossible from then on.
The possibility of emancipation . To
model this effect, all the families of each municipality are analysed;
those families that have children of an age between twenty and forty
years have a probability that a child will leave home. The simulation
put the list of emancipated children into couples to form new families. Those families initially begin living in
rented accommodation, waiting to buy a house in future iterations. The
characteristics of the newly created families are not random. They are
consequence of the couple's inherited characteristics that have formed
this new family.
After emancipation, the immigration effect occurs according
to the parameter ratePopulationGrowth. The population
of each municipality increases proportionally to the value of the
parameter specified in the window of configuration of each municipality.
These new immigrant families are formed randomly according to the
parameters defined in the municipality and they initially also begin
living in a rented house.
The families that rent try to buy a house. Each family tries
to move to any place inside the region with the only conditions being
having enough money to buy the house and of having enough space in the
house for the family. Each family tries that every iteration. With this
step, we finished the execution of the social module.
4. Agents establish their consumption desires for that period.
(Water Demand Module).
4.1. Consumption desires are a function of factors like the social
class, the housing type, number of members in the family and whether we
are in an emergency situation or not. With all these factors we
determine an initial number of irrigation, showers, washes and WC uses
for that month.
4.2. These initial values are modified by a "remember factor" of
the consumption in the previous month. The families store their
consumption in the previous period, if this consumption was higher than
the current desires, their consumption desires increase, but however, if
this consumption was inferior, they don't modify it. This factor is an
effect of asymmetric inertia about consumption desires that enables its
growth.
4.3. Lastly, to complete the determination of the consumption
desires of each family there is an imitative effect among families. The
families interact among them choosing several (three) of them inside
their neighbourhood, and watching their consumption in the previous
period. If the consumption of its neighbouring families was higher than
its own, they perceive it as “free rider” behaviour and
they try to compensate for it by increasing their own consumption
desires. On the other side, if the consumption of the neighbouring
families was lower than the own, they try to modify their consumption
habits to adapt to the predominant social behaviour in the vicinity.
When this step finishes, all the families know their consumption desires
for the period.
5. Once the families know their consumption desires for the
current period, they adapt them to their economic reality. Each family
is willing to pay randomly between 2-3% of their annual incomes for the
consumption of water as a maximum. The families compare their
consumption desires with the policy of prices that is active in that
period, if their water expense is lower than the limit that they set for
themselves, their real consumption will coincide with their consumption
desires and they won't be dissatisfied as regards
water. However if their consumption exceeds their budget, they will
reduce their expense so that it doesn't overcome the limit. In this
case the agents will increase their "unhappiness" in the cubic meters
difference between their desires and their reality. (Water Demand
Module).
6. When all the families know exactly their water expense and
the extent of their dissatisfaction, the program aggregates the demand.
(Water Demand Module).
7. The program evaluates if the region is in an emergency
situation due to water scarcity. (Emergency Flag)
8. The indexes of occupation by housing type of each
municipality are calculated. (Territorial Module).
9. The wage corresponding to each family is added to its
accumulated wealth. (Social Module).
10. The expansion of the municipalities takes place. We divide
the possible expansion of the municipalities in 8 regions, each one of
them with a housing type assigned by municipal plan. In the step 8 the
simulation had already calculated the different occupation indexes of
each municipality for housing type. If some of them exceed a certain
value, those regions with types of assigned housing equal to those of
high occupation index grow. This growth takes place inversely with a
function of probability proportional to the distance to the initially
built municipal area.
Figure 23. Diagram of
the regions that are defined in a Municipality.
11. The program executes the process of the population's death. A
similar process for the birth or the emancipation is used. Each one of
the existing families is analysed, and in those families that have more
than 40 years of life, there is a probability of death of some of their
members. When a family doesn't have any member that family disappears
and it leaves its house empty.
|
Family’s
age
|
Born
|
Home
Leaving
|
Death
|
|
0-10
|
Prob++
|
|
|
|
10-20
|
Prob++
|
|
|
|
20-30
|
|
Prob--
|
|
|
30-40
|
|
Prob--
|
|
|
40-60
|
|
|
Prob--
|
Table 5. Synoptic chart of the family evolution model.
Annual
steps:
1. The only annual action that is executed in the program is the
increase of the price of the housing of each municipality depending on
the index of occupation of the municipality. If this index is lower than
a certain value the price of housing doesn't increase that year, in the
contrary case, the housing price increases in the proportion to the
parameter growthHousingPrice. This process tries to
make the market in real estate into an endogenous process.
There is
a complete model of migration and population distribution in the region
that is intended to ascertain the effects of the territorial change
happening in the metropolitan region of Barcelona. This model could be
used for similar studies with other goods: electricity, gas, public
transportation, etc.
There is
also a module where different water prices are computed depending on
whether water is considered a pure public good, a pure economic good
suitable for a market price, or a mix of those. This module is used to
evaluate in an objective way the effects of different price policies.
The
final version suitable for stakeholders’ use has been implemented in
Java. Notwithstanding, this version has been built based the SDML
version, which is more appropriate for pure qualitative analysis and a
better understanding of the model.
Language: Java 1.3.1- b24
Environment: JBuilder 6
Platform: PC
Libraries: JFreeChart, Swarm
Source code available: adlo@eis.uva.es
Documentation:
Developers: Adolfo López,
José Manuel Galán
Language: SDML 3.4.c
Source code available: adlo@eis.uva.es
Developers: Adolfo López
In this
section we show some of the most significant windows that give
information about model. All the windows
are very intuitive, and they seek to reflect most of the outstanding
information in the model.
Changes of Citizens. This window
shows the number of people who sell/buy their house in every
municipality of the model. This chart analyses the numbers of movements
in the migration module.
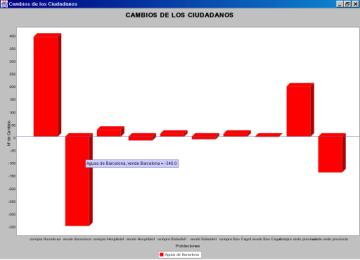
Figure 24. Number of citizens moving
across municipalities.
The Region. This window shows a map
in which every municipality and every housing type is represented with a
colour code.
1. Red.- A flat.
2. Yellow.- detached house.
3. Green.- semi-detached house.
4. Black.- A cell without building.
Figure 25. Map
of the municipalities.
Social Class. This window is a map
of the grid that represents the majority class of each house. The colour code of this is as follows:
1. Red. - High class.
2. Yellow. - Low class.
3. Green. - Middle class.
4. Black. - A cell without people.
Figure 26. Social classes distribution.
Water Demand. This window represents
a map of the region with a colour code. It is the same map as the
previous ones, but with different tonalities of blue. The darker blue
represents higher consumption of water.
Figure 27. Distribution of water
consumptions in the region.
Temporary evolution of the demand of water. It is a graph that shows the demand of water of each
municipality in every period of simulation.
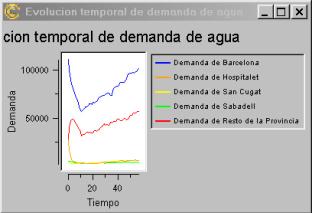
Figure 28. Temporary evolution of the
demand of water.
Temporary evolution of
the demand of water for housing type in Barcelona
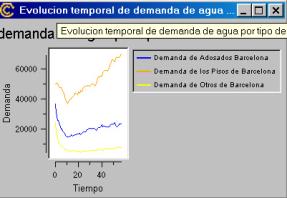
Figure 29. Temporary evolution of the
demand of water for housing type in Barcelona.
People's
temporary evolution
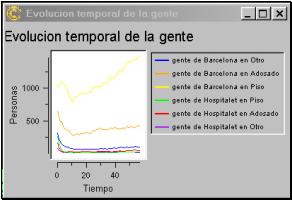
Figure 30. People's temporary
evolution.
Previous
versions of the model were useful in stimulating and informing
consultations with the water companies.
Agent
based modelling is suitable to improve the stakeholders’ knowledge on
the dynamics that appear in the whole system in relation to the
different policies. They claim realism in the model as the main basis to
consider results and conclusions from the models. We assume that there
are two levels of specification in agent based modelling when we develop
software tools. One is intended for modellers and qualitative
researchers, and can be managed through programs like SDML, Prolog, etc.
The other should be adapted to user specifications with graphic
interfaces, etc.
Climate
is not yet fully integrated in the model. More disaggregation in the
human water consumption can be required by water companies. They could
finance such studies to be introduced in the model/software.
Greater
realism is possible through a characterization of the metropolitan
region as a grid where housing is identified in a similar way to that of
the model.
When we execute the
program a first standard window is displayed. This window gives us the
general options for the control of execution of any simulation. These
options that are offered are five:
Ø Start. When we press
this button the simulation begins.
Ø Stop. When we press
stop, we stop the execution, but if we pulse in Start again we continue
the execution.
Ø Next. The program
executes a complete period of the simulation and stops. It is good to
execute a simulation step by step.
Ø Save. To record a
simulation.
Ø Quit. We leave the
simulation, end of the execution.
Figure 31. Window
of control of execution of the process.
When this window appears, also
other windows also appear to give us information about the simulation,
and to allow us to configure it. We will explain the functionality of
each one of these windows.
ModelSwarm. This
window is a probe to the model, and it allows us to configure the most
important parameters in the simulation.
The window contains
variables in array, with the name of the variable in the left part and
with a changeable cell where we can introduce the value more interesting
of the variable on the right.
The
different parameters that we can control in this window are:
· worldXSize: The
number on cells in X-dimension in the grid.
· worldYSize: The
number on cells in Y-dimension in the grid.
· endTime: period of
finalization of the simulation..
· probMigracion:
migration probability.
· totalUnhappiness. It
is the total unhappiness of all the citizens in a period of time in
unsatisfied m3 of water.
· moneyCollected. It
is the quantity of money collected due to water consumption. The money
spent in infrastructures is also entered here.
· emergency. This
parameter determines percentage of the total capacity of accumulation of
water under which the region is in an emergency situation.
· emergencyFlag. It is
a boolean variable with two possible states, false, if
we are not in an emergency situation and true if we are.
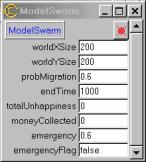
Figure 32.
ModelSwarm window.
Ø ObserverSwarm. This
window controls general parameters related with the way of representing
the data collected in the model. It is a window that allows us to
configure the Observer.
This
window controls the following parameters:
· displayFrecuency:
this variable determines each how many periods we want to pick up
information on the model
· zoomFactor: this
variable allows to configure the size of the window “The
region”.
· zoomFactor2: this
variable allows us to configure the size of the window “Water
Consume”.
· zoomFactor3: this
variable allows us to configure the size of the window “Social
Classes”
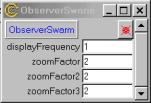
Figure 33. ObserverSwarm window.
Ø FamilyParams. This
window allows us to configure the general parameters of the families
that participate in the model. These parameters, are the following ones:
· highClassMaxWage: wage annual maximum of a high class family.
· highClassMinWage: wage
annual minimum of a high class family.
· lowClassMaxWage: wage
annual maximum of a low class family.
· lowClassMinWage: wage
annual minimum of a low class family.
· mediumClassMaxWage: wage
annual maximum of a medium class family.
· mediumClassMinWage: wage
annual minimum of a medium class family.
· highClassMaxInitialWealth: initial wealth maximum of a high class citizen.
· highClassMinInitialWealth: initial wealth minimum of a high class citizen.
· lowClassMaxInitialWealth: initial wealth maximum of a low class citizen.
· lowClassMinInitialWealth: initial wealth minimum of a low class citizen.
· mediumClassMaxInitialWealth: initial wealth maximum of a medium class citizen.
· mediumClassMinInitialWealth: initial wealth minimum of a medium class citizen.
· probSolidarityAttitude: Percentage of families with solidary attitude that reduce
their demand when there is an emergency situation.
· weigthMyHouseAgainstMyNeighborhood: The weight of my house against that of the rest of the
neighbourhood to calculate the mean price of the neighbourhood .
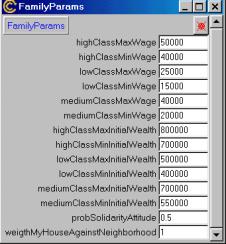
Figure 34. Window
of the parameters of the families.
Ø Municipality: This
window allows us to configure the general parameters of each
municipality in the simulation. Each one of the municipalities possesses
their own configuration window, in such a way that a window is
displayed for each municipality in the model.
The parameters in this window are
the following ones:
· name: Name of the
municipality.
· x1: Initial
situation coordinate of the municipality in the grid.
· x2: Initial
situation coordinate of the municipality in the grid.
· y1: Initial
situation coordinate of the municipality in the grid.
· y2: Initial
situation coordinate of the municipality in the grid.
· a1: Coordinate of
the maximum situation of the municipality in the grid.
· b1: Coordinate of
the maximum situation of the municipality in the grid.
· a2: Coordinate of
the maximum situation of the municipality in the grid.
· b2: Coordinate of
the maximum situation of the municipality in the grid.
· probSemiDetached: Ratio
of initial semi-detached houses in a municipality.
· probFlat: Ratio of
initial flats in a municipality.
· probUnifamiliar: Ratio
of initial detached houses in a municipality.
· probHighClass: Percentage
of high class in the municipality.
· probMediumClass: Percentage
of medium class in the municipality.
· probLowClass: Percentage
of high low in the municipality.
· initialPopulation: Initial
population in the municipality.
· priceMinSemiDetached: Minimum price of a semi-detached house in the municipality.
· priceMaxSemiDetached: Maximum price of a semi-detached house in the municipality.
· priceMinFlat: Minimum
price of a flat in the municipality.
· priceMaxFlat: Maximum
price of a flat in the municipality.
· priceMinUnifamiliar: Minimum
price of a detached house in the municipality..
· priceMaxUnifamiliar: Maximum
price of a detached in the municipality.
· priceMinUnbuild: Minimum
price of a land without edification in the municipality.
· priceMaxUnbuild: Maximum
price of a land without edification in the
· municipality.
· growthHousigPrice: Annual
increase of prices of the housing in the municipality.
· ratePopulationGrowth: rate of the population's growth in the municipality monthly.
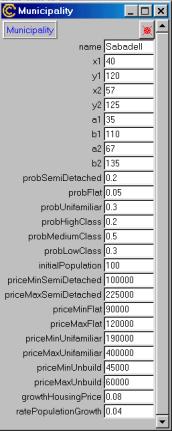
Figure 35. Configuration window of a Municipality.
Ø Supply. This window
controls the infrastructures of the region. It has two probes to the
variables that determine the number of reservoirs and of desalination
plants, but it also has two probes to methods. These probes have two
buttons that can be pressed at any time in the simulation and allow us
to increase by a unit the number of infrastructures in time of
simulation without stopping the simulation.
The variables that are controlled
by this window are:
· numReservoirs: Number
of reservoirs in the Region.
· numDesalinationPlant: Number of desalination plants in the Region.
The
methods that can be executed from this window are:
· increaseReservoir: This
method increases by an unit the number of reservoirs of the Region.
· increaseDesalinationPlant: This method increases by an unit the number of desalination
plants of the Region.
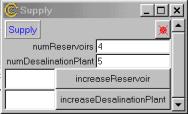
Figure 36.
Configuration window of Supply.
Ø PolicyPrice. This
window allows us to control and to test different policies of prices for
the management of the water and even to change the type of the policy
in real time in the execution process.
Three
different policies have been implemented, policy of unique price, policy
of fixed cost and variable cost from certain consumption, and price
policy according to consumption range.
The
variables that are controlled in this window are:
· typeOfPolicy: This
variable allows us to control which policy of prices is being used in a
given moment.
q Unique Price
q Fixed Cost and variable cost.
q Prices depending on ranges.
· uniquePrice: Price
of a m3 of water in the policy of unique price.
· fixedCost: Fixed
cost of the water if you consume less than minConsume in
the policy of fixed cost and variable cost.
· variableCost: Price
of a m3 of water when a family overcome the limit of
consumption minConsume in the policy of fixed cost and
variable cost.
· minConsume: Limit
between the fixed cost and the variable cost.
· section1: Limit of
consumption with the rate of prices from 0 to 1.
· section2: Limit of
consumption with the rate of prices from 1 to 2.
· section3: Limit of
consumption with the rate of prices from 2 to 3. If a family overcome
this consumption, will be applied rate of prices price_3_andMore.
· price_0_1: Price of
the first range of consumption.
· price_1_2: Price of
the second range of consumption.
· price_2_3: Price of
the third range of consumption.
· price_3_andMore: Price
of the last range of consumption.
The methods that can be executed
from this window and that allow us to modify the policies of prices in
time of execution are:
· strategyChange: It
allows us to change the policy of prices among the three possible
strategies.
· increaseUniquePrice: Increase
the unique price.
· decreaseUniquePrice: Decrease
the unique price.
· increaseVariableCost: Increase the variable cost..
· decreaseVariableCost: Decrease the variable cost..
· increaseFixedCost: Increase
the fixed cost.
· DecreaseFixedCost: Decrease
the fixed cost.
· increaseMinConsume: Increase
the minimum consumption.
· decreaseMinConsume: Decrease
the minimum consumption.
Figure 37.
Configuration window of PolicyPrice.
ZWG1 – EAWAG: Claudia
Pahl-Wostl, Matt Hare, Davide Medugno (no writing).
ZWG2 – EAWAG: Claudia
Pahl-Wostl, Matt Hare, Davide Medugno, Johannes Heeb, Felix Huber.
ZWG3 - University of Surrey: Nigel
Gilbert, Tasia Asakawa, Matt Hare, Sarah Maltby and Claire Haggett .
The following models have been developed as a
result of the group model building participatory process carried out by
EAWAG to investigate how social learning can guide the future management
of the water supply system in Stadt Zürich. Three implementations of
the basic model have been developed. The basic model is referred to as
ZWG* and is an abstraction of how the key actors (water utilities,
housing associations, consumers, manufacturers and politicians)
interact in relation to the provision and consumption of water and
water saving products in the city. The corresponding object model and
interaction diagram for ZWG* can be found in Appendix A.
The purpose of ZWG* is to provide a standard
template for the development of three models:
ZWG1 - a computer
simulation in which agents are computer automata
ZWG2 - a role playing game in which agents are
played by human stakeholders
ZWG3 - a version of the ZWG2 that is played on the
internet using either human or computerised agent players. This version
has been developed by the University of Surrey.
The purpose of ZWG1 is to provide rapid scenario
testing for scenarios generated in the participatory process. Users: EAWAG facilitators
The purpose of ZWG2 is to provide a forum for the
group to explore single scenarios in depth. Since the stakeholders in
the group take on roles within the game, they become actively embedded
in the model, not just passive observers of it.
It allows the stakeholders to perceive the system in its complexity
from the perspectives of other players. It is also to acclimatise the
stakeholders to the use of ZWG1 and ZWG3 and
to validate the basic model ZWG*. Users: Stakeholders
The purpose of ZWG3 is to provide a virtual
extension of the participatory process so that stakeholders can continue
to explore scenarios automatically or through role playing after the
completion of the project. It is also intended as a demonstration or
‘proof-of-concept’ of the idea of using business strategy games in the
context of integrated assessment. Users: Stakeholders,
public.
ZWG2 has been used as intended. ZWG1 is in the
process of being used. ZWG3 is still being tested with non-stakeholder
users and has not been used with stakeholders and members of the public
in a participatory setting yet.
ZWG1 has been used to calibrate ZWG2. ZWG2 in turn
has been used to elicit decision making algorithms from the stakeholders
during role playing so that agent models in ZWG1 and ZWG3 can be
improved.
The three agent-based social simulation models
presented here are built upon the participation of decision-making
stakeholder groups as well as experts in water resource management in
Stadt Zürich. This participatory
methodology includes face-to-face group communication, knowledge
elicitation, role-playing, scenario testing and group model building
within regular meetings of the principal stakeholders. During these
meetings, multi-media (paper-, board game- and computer-based)
multi-agent models of the water management system (ZWG1 & ZWG2) have
been developed in order to allow the stakeholders to explore possible
management scenarios and to learn about other stakeholders' often
conflicting perspectives and goals. Outside of the meetings, the
internet forum (ZWG3) will serve to support stakeholder interaction,
model testing and the exchange of views. By
drawing and these different stakeholder groups and mediums together in
the modelling process, the models and their developers begin to be able
to advance cooperation and understanding between all participants.
The models have assisted the analysis of water
resource management in Zürich in the following areas: hydrosocial
issues of water-supply; water demand; waste water treatment; water
security; and the assemblage of data for agent-based modelling. The group model building process and group use
of the models have shown that the hydrosocial issues in Zürich form a
complex decision-making framework characterized by incomplete
information, inconsistent and isolated communication networks,
conflicting and inefficient institutional settings and an
incompatibility between “worst-case” planning and changing consumer
behaviour. These issues have been
considered more closely and alternatives to current management have been
investigated. More generally, it is hoped
that the models and participatory methodology can help to identify
particular water resource management problems/issues in a specific area
and provide methods that could support conflict resolution regarding
issues of water resource management.
The Zürich water game models contribute a regional
integrated assessment tool to the FIRMA project. It
offers a participatory methodology as well as a multiple model
development process that could be incorporated into other methodologies
and processes in the FIRMA or other projects for broader applicability.
11.6.1 Intended
interpretation
The model is intended to be an abstraction of the
system for social learning purposes. It has been deliberately calibrated
to match reality qualitatively, but not quantitatively in order to
concentrate stakeholders’ discussions on dynamics rather than on
quantities.
11.6.2 Original
Sources for Model Design
The sources of the design came from the mental
models of the stakeholders in the participatory process - through a long
process of knowledge elicitation. Also
from the PhD work of Tillmann (ref).
11.6.3 Static
Structure
In ZWG*, there is a set of system indicators which
provide the agents, the housing associations, the manufacturers, the
water utility and the waste water utility and politician, with a view of
the state of the system. The water utility must maintain the water
supply by managing its reservoirs and keeping the water clean and gains
income by selling the water to the consumers living in the housing
associations (a large proportion of consumers live in rented property in
this city). The housing associations in turn must maintain the water
systems in the houses and are responsible for paying the water bill. It
may therefore be in their interest to install water saving technologies
into the houses to reduce use, since consumer demand for water is a
simple function of technology used and their level of environmental
awareness which can be raised through utility or political advertising.
The manufacturers then enter into a market with the housing associations
in which they can opt to sell normal or water saving water supply
technologies. The politician must maintain the system indicators (e.g.
water quality, supply) in order to remain popular enough to be
re-elected every five years. He or she does this through prudent use of
subsidies to the utilities, imposition of taxes and through advertising.
See also appendix A
11.6.4 Temporal
Structure
A market for water saving and normal water
sanitation goods is dynamically created between the housing associations
and the manufacturers. The outcome of this dynamic process will affect
the amount of water consumed by the houses under the jurisdiction of
the housing associations.
Output variables:
· taxation
income
· popularity
of politician
· quality
of drinking water
· quality
of lake water
· environmental
awareness of public
· water
demand of public
· water
supply to public
· water
price per unit
· price
of water saving water sanitation systems
· price
of normal water sanitation systems
· sales
of normal and water saving water sanitation systems
11.6.5 Important
Parameters
Initial values of :
· popularity
of politician (int: {0-10})
· quality
of drinking water (int: {0-10})
· quality
of lake water (int: {0-10})
· environmental
awareness of public (int: {0-10})
· water
demand of public (int: {0-100})
· water
supply to public (int: {0-100})
· water
price per unit (int: {0-100})
· max
price of water sanitation system (int)
· maintenance
costs of reservoirs, sanitation systems, factories (int)
· tax
rate (%)
· demand/household
lookup table (int[][])
11.6.6 Initialisation
Models are parameterised to reflect particular
scenarios. Default scenario: Over capacity in a perfect world:
· popularity
of politician = 5
· quality
of drinking water = 8
· quality
of lake water = 8
· environmental
awareness of public = 5
· water
demand of public = 60
· water
supply to public = 100
· water
price per unit = 5
· max
price of water sanitation system = 750
· maintenance
costs of reservoirs, sanitation systems, factories
· reservoir
maintenance: 50
· house
maintenance: 25
· factories:
100 (normal), 150 (water saving)
· tax
rate: 10%
· demand/household
lookup table:
|
|
environmental
awareness
|
|
Sanitation
system in house
|
1
|
2
|
4
|
4-6
|
7-10
|
|
normal
|
10
|
9
|
7
|
6
|
4
|
|
water saving
|
5
|
4
|
3
|
3
|
2
|
Table 6. "Demand per
household" lookup table.
· 1 simulation time step = 2
years.
11.6.7 Key
Algorithms
a) Bargaining algorithm: housing
association (HA) and manufacturer (Man) ("BargainPrice", Appendix A)
Figure 38. Bargaining Algorithm-
price negotiation
b) Decision algorithm: Water Utility
decision on priority action per turn ("ChooseAct" Appendix A)
Figure 39.
Decision Algorithm: Water Utility
11.6.8 Description
of Model Dynamics
An example (based on results from ZWG2): The water
utility reacts to over supply by taking the opportunity to close a
reservoir. The housing associations indicate the desire to reduce their
water bills by encouraging the politician to advertise to encourage
increased water saving behaviour amongst householders. This policy fails
and the housing associations look towards technology in the form of
water saving water systems for their households. This demand initiates
a competitive response amongst the manufacturers who both change
production in half their factories over to making water saving systems.
The competition for both normal and water saving systems is so fierce
that prices are rapidly driven ever lower, leading to healthy profits
for the housing associations and one of the manufacturers, whilst the
second manufacturer is reduced to subsidence.
As demand sinks due to the installation of the
water saving systems, pressure is reduced on the water utility in that
it can now afford to shut a further reservoir when it gets into
financial difficulties due to the need to repair two reservoirs at the
same time as revenues are falling from water bills. However, for the
waste water utility, the fall in demand puts double pressure on them in
that the higher concentration of wastes in the water outtake pipes makes
it harder to maintain the lake water quality with basic purification
methods. Crisis point is reached when the incoming money from bills is
not enough to cover even the basic level
of waste water purification methods. The two water utilities combine to
encourage the politician to increase water prices in order to maintain
basic services. The politician, realising that an election is due,
dares not raise prices and happily realises that a buoyant private
sector created as a result of the demand for water saving systems raises
enough taxes for a temporarily high level of government subsidies.
After a successful re-election, however, the politician raises the
water price to make a further improvement to the system.
11.6.9 Implementation
Language
ZWG1:
language: Java 1.3.1- b24
Environment: JBuilder 6
Platform: PC
Libraries: Quicksilver
Source code available: (available on request)
Documentation: see file ModelDocs.zip
(available on request)
Developers: EAWAG
ZWG2:
language: paper and pencil
Environment: meeting room
Platform: table
Source code available: (available on request)
Documentation: see file
WasserSpielVersion2.doc (available on request)
Developers: EAWAG
ZWG3:
language: PHP, HTML< Javascript
Environment: Server: APACHE, POstgreSQL. Client: Internet
explorer 6 or Netscape 6
Platform: Server: Any
Unix. Client: Any.
Source code available:
http://www.soc.surrey.ac.uk/zwg3/source.php
Documentation: see bibliography
Developers: University of Surrey
11.6.10 Instructions
for Running ZWG3 Code
The files provided should be copied to a directory
on a host running the Apache (www.apache.org) web server. The
directory must be within the document tree served by the the host. The server should also be running PHP
(www.php.net) and PostgreSQL (www.postgres.org).
To run the game, PHP must have the configuration
parameter 'register_globals' in the configuration file php.ini set to
'On'. This was the default setting until
version 4.2, but more recent versions have the parameter set to 'Off',
and so this must be changed before starting the game.
One must first create a Postgresql database. To do this, point a web browser to the ZWG3
page 'createdb.php'. This page is web form
that requests the database administrator's username and password. Complete these fields and click on 'Go'. The database will be created.
The program can then be used, by pointing a
browser at 'index.html' in the program directory. Players
will need to be told that the password to enter the game is 'firma'.
Alternatively, the game can be run from the
project's web site; see http://firma.cfpm.org/games.html
11.7.1 Example
Simulation Output
ZWG1:
Figure 40
shows the results of a Monte Carlo simulation of 3 different scenarios
which look at the sensitivity of three system indicators given different
levels of environmental awareness in the population (an awareness that
can be manipulated by policy makers through advertising campaigns). Each scenario lasts 20 simulation years and is
repeated 110 times to produce the cumulative probability curves. These
results show that, as expected, increasing the environmental awareness
of the population leads to decreased drinking water demand as consumers
attempt to save water. For example, the water demand graph shows that
when environmental awareness is 5 then there is a 0.95 probability that
the scenario will end in water demand being at least 50 units. When it
rises to 10, the probability that it will be higher than 50 is only
0.45 and for values higher than 60, there is no probability at all.
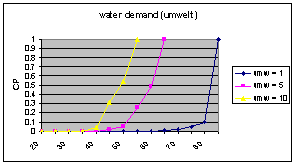
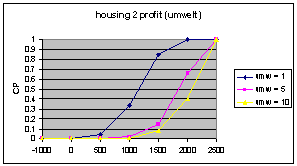
Figure 40. The cumulative
probabilities (CP) of values for three system indicators at the end of a
20 year simulation: the drinking water demand; the water utility
profits and housing association profits (averaged over the final five
years of the simulation).
Water utility profits rely on maintaining a
balance between supply and demand and a high amount of demand, since
reservoirs cost money to be maintained and the only income is from water
consumption. The water utility profits graph thus shows a non-linear
relationship between environmental awareness and profits. As
environmental awareness rises from 5 to 10, the probability of profits
being lower than -2500 rises from 0.05 to 0.3. This shows the impact of
the loss of income from water demand. However, when the environmental
awareness falls to 1, the water demand is so high that extra reservoirs
need to be built to maintain the water supply/demand ratio above 1.
Hence increased costs of maintenance and construction outweigh increases
in consumption income.
Whilst the likelihood of high water utility
profits decreases with an increase in awareness from 5 to 10, the
probability of higher profits for the housing associations increases.
Purchases of water saving technology by housing associations seeking to
save costs, allied to an awareness-induced decrease in water consumption
by their tenants, lead to lower water bills.
ZWG2:
One example of output (in addition to Section
1.2.8, above) is the change in prices of water systems during the game session used to
generate a bargaining algorithm (Table 2).
|
Round
|
Hersteller1
|
hersteller2
|
Accepted L 1
|
Accepted L2
|
|
|
Norm
|
WS max 1
|
Norm
|
WS (max 1 to
sell)
|
Norm
|
WS
|
Norm
|
WS
|
|
2
|
150
(L2)
|
500(300 ) 300 (L2)
|
250
(L2)
|
400(300) 300 (L1)
|
|
300
|
250/150
|
300
|
|
3
|
400
for both
|
400
for both (L1)
|
250 (L1)
|
300
(L2)
300 (L1)
|
400
for both
|
|
|
300
|
|
4
|
|
250 (L2)
|
400
for both (L1)
|
300 (L2) (200)
250
|
400
for both
|
|
|
250
|
|
5
|
150 (L1)
|
200 (L1) (180)
|
150 (L1)
|
250 (L1) (180)
180
|
|
180
|
|
|
|
6
|
|
200 (L2)
|
|
250 (L2)
|
|
|
|
200
|
Table 7. Prices
of Water sanitation systems during a ZWG2 game. Bold means a sale was
agreed: price in brackets is a counter bid by a housing association -
therefore "400 (300) 300 (L1)" means that the initial bid was 400,
followed by a counter bid from housing association L1 of 300 which was
agreed by the manufacturer and L1 bought at this price.
ZWG3:
ZWG3 is a strategy game, where
the output is displayed to players interactively on the web browsers. It is therefore hard to get a sense of the
output in the same way as a normal simulation. However,
all actions within the program, both those made by computational agents
and those by human players, are logged and Figure 41 shows an excerpt from a typical log file.
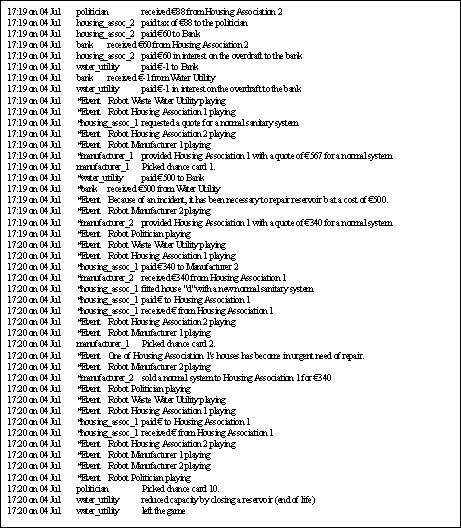
Figure 41. Output Protocol from
ZWG3
11.7.2 Results
claimed as significant
The results of the use of the models is mainly in
terms of how the stakeholders' discussion have developed with their use.
The main finding is that the stakeholders have moved away from water
saving-based management solutions to looking at how security and
efficiency of supply can be first managed.
In terms of social learning, the gaming has
generated discussions on the possible undesired consequences of water
saving in the city without control of water demand and reduction of
supply infrastructure. It has shown how the aggressive marketing of
water saving systems in a market willing to buy them, can have serious
consequences for the water utilities, e.g. over capacity problems, poor
finances, threatened water quality. There have also been debates on the
institutional inadequacy of splitting the water supply and waste water
utilities, and the possible sources of funding for subsidies for these
utilities.
As noted above, during the gaming sessions there
were debates about possible funding sources for utility subsidies which
would help assuage the high level of utility debts caused by
environmentally aware water saving and a consequent fall in demand.
Given the scenarios developed in ZWG1, it becomes clear that one source
may be the housing associations. A tax could be included in the price of the water
saving systems they buy or in the price of their water.
In addition, the feedback from ZWG2 has been used to
improve the agent-models in the ZWG1 and ZWG3. Of particular use has
been the elicitation of a bargaining model that describes how
manufacturers and housing associations bargain a price for water systems
(see
Figure 38).
In addition, the motivational rules determining agent decision making
have also been elicited.
11.7.3 Methodological
Lessons
The major methodological lesson comes from the
interaction of the three implementations in that ZWG1 can be used to
calibrate ZWG2 which can then be used to build up user confidence in and provide cognitive models for ZWG1 in return.
Individually, there has been the realisation that role playing models
must be tailored to particular uses and that the translation of a board
game to an internet version (ZWG2->ZWG3) is non -trivial.
11.7.4 Future
Development
ZWG3 is still being developed and tested for use
with stakeholders and members of the public in a participatory setting.
11.7.5 Published
works relevant to the model
Participatory
Modelling Process (ZWG*, ZWG1)
Hare, M.P., &
C. Pahl-Wostl. in press. Stakeholder categorisation in
processes of participatory integrated assessment. Integrated
Assessment.
Hare, M.P., D.
Medugno, J. Heeb & C. Pahl-Wostl (2002) An applied
methodology for participatory model building of agent-based models for
urban water management. In (Urban, C) 3rd Workshop on
Agent-Based Simulation. SCS Europe Bvba, Ghent. pp 61-66
Role
playing (ZWG 2, 3)
Asakawa,
T., Gilbert, N. in press. Synthesizing Experiences: Lessons
to be Learned from Internet-mediated Simulation Games. Simulation & Gaming An
Interdisciplinary Journal of Theory Practice and Research.
Gilbert, N., S.
Maltby and T. Asakawa. (2002) Participatory
simulations for developing scenarios in environmental resource
management. In (Urban, C) 3rd
Workshop on Agent-Based Simulation. SCS Europe Bvba, Ghent. pp 67-72
Hare, M.P., N.
Gilbert, D. Medugno, T. Asakawa, J. Heeb & C. Pahl-Wostl. (2001) The development of an internet forum for long-term
participatory group learning about problems and solutions to sustainable
urban water supply management. In Hilty, L.M. & Gilgen, P.W.
(Eds) Sustainability in the Information Society,
15th International Symposium Informatics for Environmental Protection,
Part 2. Metropolis Verlag, Marburg. pp743-750. ISBN: 3-89518-370-9.
Hare, M.P.,J. Heeb
& C. Pahl-Wostl (2002) The Symbiotic Relationship
between Role Playing Games and Model Development: A case study in
participatory model building and social learning for sustainable urban
water management. Proceedings of ISEE, 2002, Sousse, Tunisia
Hare, M.P., N.
Gilbert, S. Maltby & C. Pahl-Wostl (2002) An
Internet-based Role Playing Game for Developing Stakeholders' Strategies
for Sustainable Urban Water Management : Experiences and Comparisons
with Face-to-Face Gaming. Proceedings of ISEE 2002,
Sousse, Tunisia
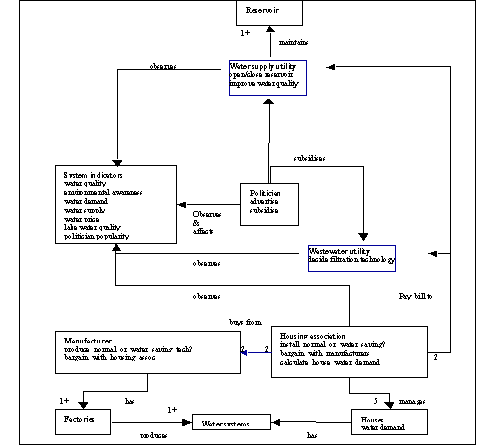
Figure 42.
The Object Model of ZWG*
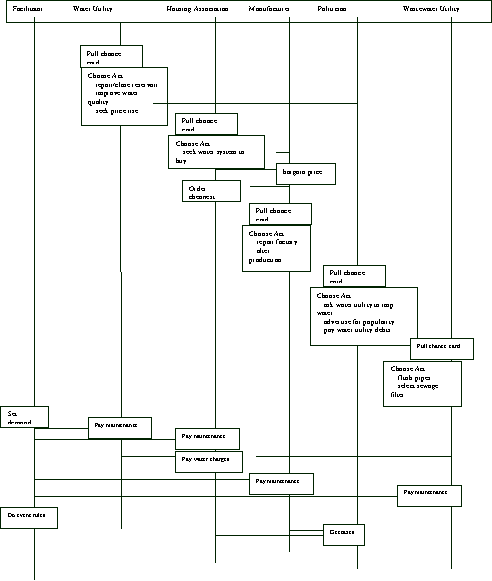
Figure 43.
The Interaction Diagram of ZWG*
Olivier Barthelemy, Bruce Edmonds and Scott Moss,
Centre for Policy Modelling
12.1.1 Description
Domain Context
Water demand management necessities have pushed
the institutions as well as the companies to try to predict the
consumption of drinking water for households in the near future. The
timescale of structural decisions is such that no existing tool was able
to inform such decisions that had no well-known flaws. Therefore this
model is using a Multi Agent System approach. It allows a dynamical
evolution of the system structures as well as the agents.
12.1.2 Original
Purpose of Model
This model is devised to be used by stakeholders
in different situations: Typically, the water companies should infer
from the simulated behaviour some possible future patterns of water
consumption in the presence of climate change. Also, because of the
explicit processes represented in it, it is a very good starting point
for a common language and/or reflection and hence will facilitate the
participative process.
12.1.3 How
was the Model Actually Used
Presented to stakeholders, the model was commented
on and modified in accordance with their remarks. It will be used as the
basis of a role playing session with the participation of the
environment agency, water companies, and customers. The actual building
process for the model raised previously unasked questions and led to a
different kind of reflection from the participating stakeholders.
12.1.4 Relationship
to other Models
The first version of this model was developed by
Scott Moss, and will be published in a forthcoming volume of Integrated
Assessment. The now revised version uses some of the original modules,
but has more possibilities, including for example some different
adoption processes.
It retains from the initial model the ground and
policy behaviours, the grid positioning, the process of communicating,
as well as the endorsing method. The modifications were added to the
imitation process (more precisely in the selection of the actions to
imitate), the possible variations of main influences for households (how
important is the influence of the different components of their
environment), and to the innovation emergence (implementation of a more
realistic breakdown and replacement process), as well as to the
available appliances and their properties.
12.1.5 Relationship
to FIRMA’s Aims
This model has resulted from fairly close
cooperation and consultation with a variety of water companies in the UK. It reflects some of their concerns with demand
management, especially in times of drought. It
is an application of agent-based modelling which concentrates on the
social issue of imitation and suggestion as it interacts with domestic
water demand. It is planned that it may
form part of a participatory exercise with representatives of water
companies to be run by SEI/ECI at Oxford.
12.2.1 Intended
interpretation
The model results must be viewed cautiously, they
are aimed at representing the complex behaviour of real life agents, and
are not absolute numbers because the model is descriptive, in the sense
that all its components are explicit relations, designed to make it
easy for stakeholders to understand. The agent base leads to an easy
identification from stakeholders to some of the software agents in the
model. Because of the analogy it is straightforward to identify the
role, environment and actions or reactions of each agent.
12.2.2 Original
Sources for Model Design
The initial model has been created from basic
rules of behaviour and stakeholders’ suggestions. Although it is still
mainly based on this first representation, it has evolved according to
the remarks made in meetings and additional information about the
behaviour of agents involved.
The endorsements idea and implementation takes its
sources in sociology (Brown ??? for the particular liaison between most
identical agents, Cohen ???? for the endorsements). The ground has been
modelled using geographical references and algorithms.
12.2.3 Static
Structure
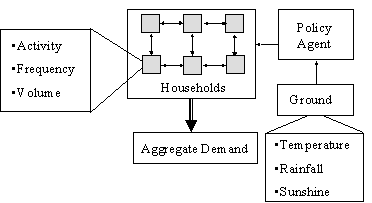
Figure 44.
Structure of the model
The structure of the model is represented in the
diagram above. The small arrows represent the interactions, the ground,
the policy agent and the households are the main agents, and their
different properties are expressed as activity, frequency and volume, or
temperature, rainfall and sunshine.
The temperature, rainfall and sunshine are used to
compute the evapotranspiration, and the resulting soil moisture. This
moisture is hence the output of the ground part. It is taken as an input
from the Policy agent. It is being analysed, and if it is below a
specified threshold, the policy agent broadcasts some messages to reduce
water use. These messages consist of a specific (reduced) volume and
frequency of use for particular appliances. The households, defined by
their set of appliances, volume per use, and frequency of use, might
then react to these recommendations.
12.2.4 Temporal
Structure
The model can be considered as having several
interacting groups of components. The ground components, the policy
agent part, and the household part. The ground dynamically computes the
soil moisture. The Policy agent reacts to this moisture if it falls
below a predefined value. If this happens, it broadcasts a signal for
households to reduce their use of water.
12.2.5 Important
Parameters
The most important parameters in the model are the
following:
- the proportion of households in
each category (self centred, local centred, global centred), as it
influences the sensitivity of the reaction of the households to
their neighbours and their environment.
- the temperature and rainfall,
triggering or not the Policy Agent actions
- the density of households on the
grid, and the range limiting possible interactions.
12.2.6 Initialisation
The initialisation of the model requires some user
input (user), and has default values or objects / rules generation
(sdml). They are as follow.
1. (sdml)
create and activate sub agent Thames World
2. (sdml)
create and activate sub agents Thames Ground and Firma Model
3. (sdml)
create the time levels (year, month)
4. (user)
define the maximum AET (default: )
5. (user)
define the mean latitude of the area (default: 51)
6. (user)
specify the temperature and data file
7. (sdml)
initialise time level
8. (user)
specify time level boundaries (default: 12 months in a year)
9. (sdml)
kc table
10. (user)
specify precipitation data filename
11. (user)
define maximum soil water
12. (user)
define initial year
13. (user)
define final year
14. (user)
define maximum runoff
15. (user)
specify file containing name of appliances, and format
16. (sdml)
create environmental aspects
17. (user)
define weights for GS, NS, SS
18. (sdml)
time level activation
19. (user)
define grid size(default: 16*16)
20. (user)
define number of cells agents can see (default: 4)
21. (user)
specify eventual introduction of new appliances, date, and replaced
appliance
22. (user)
specify private activities
23. (user)
define rate of decay of remembered endorsements (default: 2.5)
24. (user)
define the population size (default: 100)
25. (user)
specify Weibull parameters for replaceable appliances
26. (sdml)
generation of population
27. (sdml)
generation of meta agents
This takes the user to the stage where all the
variables are initialised, and the agents are created and activated, and
ready to “behave”.
12.2.7 Key
Algorithms
The modified Thornthwaite algorithm is used to
compute the soil moisture through potential evapo transpiration (PET)
from temperature and hours of daylight per day (as in Food and
Agriculture Organisation 1986).
The value of the unadjusted PET at temperatures
above freezing is calculated as:
|
PET
|
Temperature
(T) range
|
|
-
415,8547 + 32.2441T – 0.4325T2
|
26.5
≤ T
|
|
16.5
(9 T / H) a
|
0
≤ T < 26.5
|
|
0
|
T
< 0
|
where H is heat defined as

and the exponent a is
a ≡ 6.75e-7 H 3 -
7.71e-5 H 2 + 0.01792 H + 0.49239
The day lengths are calculated from the day
relative to the winter solstice and the latitude. The monthly PET values
are adjusted to reflect the difference in water use between a grass
surface and a mixed landscape of grass, trees and shrubs. The
monthly correction factors are:
|
Nov – Dec - Jan –
Feb - March
|
April
|
May
|
June – July - Aug
|
Sept
|
Oct
|
|
0.8
|
0.9
|
1
|
1.1
|
1.05
|
0.85
|
The model also calculates the runoff of water but
this value was not used here.
Another important algorithm is used to compute and
compare endorsements. Cohen’s original endorsements approach allocated
endorsement tokens to classes of importance. The
action chosen would be that which had the most endorsements of the
highest class or, if several had the same number in the highest class,
the action that was tied in the highest class but had the most
endorsements in the second highest class. If
there was another tie at the second highest class of endorsements, the
third or if necessary the fourth or lower class would be used to break
the tie.
A more general approach, and that used here, is to
define a number base, b, and evaluate each endorsed object
according to the formula
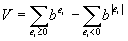
where ei is a (usually integer)
value associated with the ith endorsement token.
Negative values of endorsement tokens indicate naturally enough that
they are undesirable. The higher the value associated with an
endorsement token, the higher the class of tokens containing that
particular token. The value of b is
the importance of an endorsement token relative to the value of a token
in the class below. If the base is 2, then an endorsement of class three
contributes 8 to the endorsement value of an object while an
endorsement of class two contributes only 4. For
values of b larger than the number of tokens in any class used
to endorse any object, the results from this evaluation scheme are the
same as from Cohen’s evaluation scheme. For smaller values of b
it is possible for a large number of lesser endorsements to outweigh a
small number of endorsements of greater value.
12.2.8 Description
of Model Dynamics
Every agent will start with some endorsements on
its environment (including its own appliances). They are personal and
unique for a given time step. The system will also make a list of the
different appliances available to the agent, depending on its previous
ownership and the time.
For this set of available actions , the
endorsement value is computed, and the household agent makes the
decision of adopting or not (whether it is a change of ownership or
frequency, or volume) depending on that value.
Here is an example of the history of one action
from one agent’s point of view:
|
Month 1
|
used, endorsed
as self sourced
|
|
Month 2
|
endorsed as recent (from
personal use) and neighbour sourced (used by agent 27)
and self sourced (remembered)
|
|
Month 3
|
endorsed as recent (from
personal use) and neighbour sourced (agent 27 in month
2).
|
|
Month 4
|
endorsed as neighbour
sourced twice, used by agents 26 and 27 in month 3, also recent
|
|
Month 5
|
endorsed as neighbour
sourced (agent 26 in month 4), also recent
|
|
Month 6
|
endorsed as neighbour
sourced (agent 26 in month 5
|
|
Month 7
|
replaced by action 8472
(appeared in month 5 as neighbour sourced, now endorsed 4
times, including by the most alike neighbour – agent 50)
|
12.2.9 Implementation
details necessary to get the simulation to run but not considered
important for the results
The actions are evaluated according to their
endorsements. The possible endorsements are, for example: that the
action was used by neighbour, that the action was used by myself, that
the action was recommended by the policy agent, or that the action was
used by the most alike neighbour.
They are also dependent on the available
appliances. Each household starts with a given set of appliances. This
will not change, apart from those that are specified as replaceable. For
these, a household will collect all their endorsements, and transform
them into a single aggregate value. The higher the value, the most
favoured the appliance. So for each appliance, the household’s
behaviour will change, as a combination of the observations. A priority
is given to the newest appliance if two interchangeable appliances have
the same endorsement value.
12.2.10 Source
Code
The model is implemented in SDML. The language
itself is freely available from the Centre for Policy Modelling website.
The necessary modules for the simulation are available on request.
12.3.1 Example
Simulation Output
Here is a sample of the output from the model. It
shows the evolution of water consumption with respect to time, for some
specific parameter.
Figure 45.
The aggregate water demand resulting from a single run of the model
Some more details about the model’s output can be
obtained on request from the CPM.
12.3.2 Results
claimed as significant
One of the significant results is the observations
one can make about the imitation patterns and their sensitivity to their
own characteristics, and the climatic events for example.
12.3.3 Methodological
Lessons
Some lessons must be learnt for the participatory
component of the model. The interaction is useful for building the
model, but it did not happen as much as expected at the start of the
research. The methodology is so different from what is already existing
that most of the participants in the meetings had to be explained the
difficulties and the potential of the approach.
12.3.4 Future
Development
The model can be extended in various ways.
Firstly, it is intended to refine the adoption process of innovation, as
well as a different type of decision process from the households. It is
also possible to generate multiple policy agents with different
objectives and behaviours, for example environmental
12.3.5 Published
works relevant to the model
Olivier Barthelemy, Scott Moss, Thomas Downing and
Juliette Rouchier (2001) Policy Modelling with ABSS: The Case of Water
Demand Management. CPM Report No. 02-92.
http://cfpm.org/cpmrep92.html
Brown, R. (1965) Social Psychology, New
York: The Free Press.
Cohen, P. R. (1985) Heuristic Reasoning: an
artificial intelligence approach. Boston: Pitman.
Moss, S. (in press) Agent Based Modelling for
Integrated Assessment. Integrated Assessment.
Scott Moss, Centre for Policy Modelling
13.1.1 Description
Domain Context
It is not hard to find examples of failed
negotiations. At the same time, there are
clearly many examples of successful negotiation that form part of the
small change of everyday life. Difficult
negotiations involve both more parties and larger numbers of related
issues than do the examples of regularly successful negotiations. But there is a second difference, as well. The examples of success are negotiations among
two parties and if the parties are in fact composed of several
individuals, within each party there are no differences of goals. Whereas the large scale negotiations generally
have to reconcile a wide range of interests.
13.1.2 Original
Purpose of Model
The purpose of the model was to develop techniques
for modelling multi lateral negotiation. In particular, it was to be the
first prototype for a description of stakeholder negotiation in the
Limberg basin of the River Meuse.
13.1.3 How
was the Model Actually Used
It was used to analyse the reasons why successful
multilateral negotiation is so difficult to achieve.
13.1.4 Relationship
to other Models
This is a first-generation model that informed the
development of a second model that is intended to model in an abstract
context the actual negotiation processes among stakeholders in the
Limberg basin.
13.1.5 Relationship
to the AIMS of FIRMA
Understanding the nature of negotiation is
difficult, and yet it transpires that it is crucial to many water
management issues and problems. This model
is an investigation into this nature and informed the development of the
core negotiation model.
13.2.1 Intended
interpretation
This is an investigation into the difficulties and
limits of modelling multilateral negotiation. Although it is an abstract
model, it is intended to provide a canonical model of negotiation with
mappings to and from the negotiation setting and practices relevant to
the Limberg Basin. Within the model there
is a class of negotiating agents representing negotiators. Both
the state of the environment and the negotiating positions of the
agents are represented by digit strings. Because
the digits at each position of the digit string can take any of an
arbitrary number of integer values, the fineness of the grain of the
various negotiating positions can be captured with arbitrary precision.
13.2.2 Original
Sources for Model Design
The main design ideas are drawn from earlier
models by Moss – including his models of household demand for water in
the Thames Valley. Originally, the main
design features come from social psychology and from approaches to
conflict resolution in expert systems. Also,
this was intended to serve as a basis for a canonical model of
negotiation in the sense of (Moss, 2000).
13.2.3 Static
Structure
There are a fixed number of agents which are
attempting to haggle over the values of a fixed number of issue. They choose negotiation partners and attempt
to reach an acceptable agreement on all issues. If this occurs they form
a coalition which can then attempt to haggle with other agents or
coalitions. Thus this is a model of
multi-dimensional haggling. The model
contrasts the position with only two agents – where agreement is
possible and that with more than two where agreement (using the process
described) is not possible.
13.2.3.1 Abstract
representation of agents’ positions
The negotiating stance of each agent is
represented by two digit strings. One
string – the agent’s position string – represents the preferred
outcome of the negotiating process with respect to each issue under
discussion. The other string – the agent’s importance
string – represents the importance the agent attaches to achieving
its preferred outcome for each issue. For
example, and agent’s desired outcomes might be represented by the
position string
[2
1 4 2 3 0 0 3 2 4 1 0 2 1]
where the value at each index of the string is a
representation of the desired outcome of the negotiating process for a
particular issue. The issue corresponding
to each index of the position string is the same for every agent. The number of integer values that can be
assigned to any position is determined by the model operator at the
start of each simulation run with the model. In
this case, the values taken at each index of the position string are in
the interval [0,4].
The corresponding importance string of the agent
might be
[3
1 0 2 0 3 3 1 0 2 3 1 0 1]
indicating that the most important objectives of
the agent (indicated by the 3s in the importance string) are to obtain a
value of 2 for the issue denoted by the first digit of the strings and
the value 0 for the sixth and seventh issues and the value 1 for the 11th
issue.
The effect of the negotiation process is
necessarily represented as changes in the position strings of the
participating agents. Moreover, although
not implemented in the simulations reported below, it seems likely that
the importance attached to different positions will also change over the
course of the negotiation process – perhaps as it becomes important to
maintain common positions important to partners which whom agreement
has been reached.
13.2.4 Temporal
Structure
13.2.4.1 Selection
of negotiating partners
Agents could have any of a wide variety of
strategies for the identification of issues about which to negotiate and
for the selection of negotiating partners. At
one extreme, an agent could identify an issue and then negotiate with
every possible (or known) agent concerning that issue. At
the other extreme, agents can select other agents with which to
negotiate and determine the issues in collaboration with the selected
agents. The strategy to be modelled –
whether one of these extreme cases or some combination or set of
parallel strategies – should depend on observation and the evidence of
domain expertise.
In the model reported here, the negotiating
strategy was driven by the selection of agents as negotiating partners. The criteria for selecting an agent with which
to negotiate were based on trustworthiness, reliability, similarity,
helpfulness, acquaintanceship, untrustworthiness, unreliability,
unhelpfulness. One agent identifies
another as reliable if the other agent
responds affirmatively to a suggestion that the two agents negotiate. An agent will identify another as trustworthy
if its public negotiating position reflects previous agreements between
the two agents. An agent is helpful if it
suggests to two or more other agents that they might
usefully negotiate with one another and agreement among those agents is
realised. An agent will identify another
as similar if, among all of the negotiating positions known to the
agent, the other agent shares the largest number of position values. One agent can know another either because of
an approach at random or because the other agent has made contact by
suggesting a negotiation.
Each agent in the model has rules for attaching endorsements
– tokens reflecting the selection or aversion criteria – to other agents. The ranking of the importance of endorsements
is, in the first instance, random except that opposite endorsements
(helpful and unhelpful, trustworthy and untrustworthy, reliable and
unreliable) have rankings of the same magnitude and opposite sign. So that if trustworthy is the most important
positive endorsement, untrustworthy will be the most important negative
endorsement. Each agent will have its own
initial ranking of positive (and therefore negative) endorsements. Each agent will select the best endorsed agent
it knows as a negotiating partner at each stage.
Over the course of a negotiation process, each
agent will continue to learn about other agents – a process represented
by the ongoing attachment of endorsements. Each
agent will also learn which are the most important criteria to use in
selecting negotiating partners. If the use
of a particular set of rankings of criteria leads to the conclusion of
an agreement with a selected agent or group of agents, there is no
reason to change the relative importance of the different criteria. If no agreement is reached, then there will be
less confidence in the current ranking – though it is unlikely that a
wholesale change in rankings will follow from every failure to achieve
some agreement.
In order to capture this learning process about
endorsements and their relative values, agents’ learning is represented
by the Chialvo-Bak (1999) algorithm described below.
There are two advantages to be gained from
implementing this learning process. One is
that the simulations determine the most important criteria to be used in
choosing negotiating partners. The other
is the flexibility of the ordering of criteria since it is possible
that the importance of different criteria will change over the course
of any negotiation process. It is
possible, for example, that reliability is most important at early
stages so that there is some meaningful communication but that
trustworthiness is most important in the final stages.
13.2.5 Important
Parameters
The most important parameter of the model is the
number of negotiating agents. The results
are not highly sensitive to other parameter values such as the number of
issues (represented by the lengths of the digit strings) and the
fineness of the grain of the negotiating positions
13.2.6 Initialisation
The number of agents and the length of the digit
string representing the state of the environment are set by the model
operator. The number of positions in which
each agent has an interest and the relative importance of that interest
to the agent are the realisations of a uniform random number within
bounds set by the model operator. The parameters have no default values.
13.2.7 Key
Algorithms
The main novelty in this context is the use of the
Chialvo-Bak (ref) algorithm to represent agent learning. This algorithm
uses a sort of neural network approach but without positive
reinforcement of synapse weights. In the
present case, the input neurons are attached to endorsement tokens and
the output neurons are ranking values to be attached to the endorsements. There were five intermediate layers, each
containing 40 neurons. Starting with the
input neurons, each neuron as seven synapses out to the next layer
until the output neuron layer is reached. The
paths followed from input to output neurons is determined by the
synapse with the highest weight emanating from each neuron. When
agreement is not reached, the value of each synapse on the dominant
path is reduced by a small amount (usually by one per cent) and the sum
of the reductions is distributed equally among the rest of the (2000+)
synapses. Consequently, changes in the
behaviour of an agent take place relatively infrequently but will, from
time to time, be fairly extensive.
13.2.8 Description
of Model Dynamics
The dynamics of the model are driven by the
agents’ negotiating strategies. It is a
commonplace in the negotiation literature that the least important
issues should be addressed first. Once
negotiating styles have accommodated one another and a recognition of
reliability and trustworthiness established, there is a basis for
considering more important substantive issues. The
most difficult issues are left to the last.
Every agent in the model reported here adopts this
sort of strategy. Each agent offers to its
preferred negotiating partner a list of positions for the issues the
agent found least important among all of the issues that had not yet
been resolved. Denote the first agent as A
and A’s preferred negotiating partner as P. IfP
made some offer of negotiating positions then, if that offer contained
values for positions that A found least important, and also some
values that A found to be more important, then A would
accept P’s offer on the least important issues in exchange for P’s
acceptance of the same number of A’s positions. In
general terms, some agreement could always be reached provided the two
agents preferred to negotiate with one another and each was able to
offer to change one or more of its least important positions in exchange
for the other agent agreeing one of its more important positions.
Once any pair or larger group of agents fully
agrees on all positions, they form a coalition to negotiate with agents
not in the coalition or with other coalitions. The process ends when all
agents are members of a single coalition or super-coalition (i.e.
coalition of coalitions of coalitions …). In
practice, the only simulated negotiation processes that reached a
conclusion were all of the two-agent processes.
13.2.9 Implementation
details necessary to get the simulation to run but not considered
important for the results
The number or range of the strings representing
the issues did not seem to affect the outcomes. Nor
did the precise initialisation or size of the neural network. Although the Chialvo-Bak algorithm is
attractive in that it provides an accessible and credible learning story
it is hypothesised that the exact learning algorithm concerning the
choice of negotiation partner is not critical to the results. It is more likely that the bargaining strategy
may be improved, by being made more “intelligent” but it is thought that
unless mechanisms for intelligent coalition formation are not included
that the precise strategy is also not critical to the results.
13.2.10 Implementation
Language
SDML 4.1
13.2.11 Source
Code
Source code will be available from the website.
13.3.1 Example
Simulation Output
The progress of bilateral negotiation was
represented by changes in the differences of negotiating positions of
two agents. These differences were measured
as the Euclidian distance between the two position strings interpreted
as coordinate vectors in a 30-dimensional hyperspace. An
example of the progress represented by this measure is given in Figure46. This progress is typical of all runs with two
negotiating agents. The range of the number
of cycles elapsed before agreement was reached was from 8 to 12 with
the bulk of the distance eliminated in the last half or less of the
cycles. There was no learning for the
agents to do since they had no choice of negotiating partners.
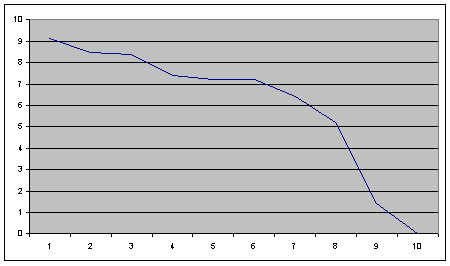
Figure 46. Distance between 2 agents in bilateral negotiation
Although simple negotiating strategies work well
for the modelled bilateral negotiation, they do not work at all in
simulations of multi lateral negotiation with three or more agents. Simply trading agreements on more important
positions in exchange for giving up less important positions is
evidently insufficient. The problem here is
that moving towards agreement with any other agent typically involves
increasing the distance to some other agent. It
is no doubt possible to devise a variety of arrangements under which
agents combine in pairs to reach agreement and form a coalition and then
pairs of coalitions negotiate to form a super-coalition and so on until
every agent is in the coalition. The value
of such an exercise is not clear. Certainly
there is no evidence that such a tree of bilateral agreements is a
realistic description of successful negotiations, though equally
certainly there is some element of small groups coming together on
particular issues.
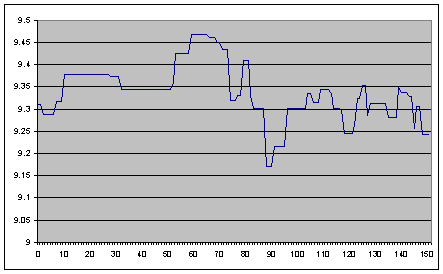
Figure 47.
Average distance between negotiating positions of agents in nine-agent
simulation
13.3.2 Results claimed as significant
That multilateral negotiation is fundamentally
different from bilateral negotiation. Lessons
obtained from modelling bilateral negotiation do not naturally or
necessarily inform the modelling of multilateral negotiation beyond two
parties.
13.3.3 Methodological Lessons
If good science starts from good observation, then
the implications of these simulation results are that we should model
actual, individual processes of multilateral negotiation. The
modelling itself will doubtless yield insights into the elements of
successful and unsuccessful negotiation processes and the modelling of a
range of such processes is likely to inform the development of
modelling techniques that apply quite generally to descriptive
simulation models.
13.3.4 Future Development
The second phase of this modelling development has
been to implement a model in which agents negotiate within an
environment characterised by self organised criticality created in part
by random events and in part by the nature of human behaviour as
represented in the model. Self organised
criticality generates clusters of volatile events characteristic of
floods, earthquakes, volcanic activity and a variety of social phenomena
of a sort that is relevant to both flood control issues and the effects
of human intervention on those activities. The
abstractions of negotiating positions and environmental states are
unchanged in the further version.
The third phase specifically incorporates
negotiating procedures and strategies as described by ICIS – our
partners developing the Limberg Basis application.
13.3.5 Published
works relevant to the model
Scott Moss (2002), “Challenges in Agent Based
Social Simulation of Multilateral Negotiation”, chapter 31 in
Dautenhahn, et al (eds.), Socially Intelligent Agents: Creating
Relationships with Computers and Roots (Kluwer Academic Publishers).
Chialvo, D. R. and P. Bak (1999). "Learning from
Mistakes." Neuroscience 90(4): 1137-1148.
Moss, S. (2000). "Canonical Tasks, Environments
and Models for Social Simulation." Computational and Mathematical
Organization Theory 6(3): 249-275.
David Hales, Centre for Policy Modelling
The Neg-o-Net model is a generic agent-based
computational simulation model for capturing multi-agency negotiations
concerning resource and environmental management decisions. The model is
intended to be generic enough to be applicable to many regional
applications with minimal re-programming. Neg-o-Net was developed by the
Centre for Policy Modelling at Manchester Metropolitan University. The
initial design was produced in collaboration with IP-CNR Rome partners.
14.1.1 Description
Domain Context
The model is a generic framework for simulating
various multi-agency negotiation processes centred on resource and
environmental management. Stakeholder “viewpoints” are represented as
networks of states of the world and actions that are believed to move
between those states. Each stakeholder (agent) has different (possibly
conflicting) viewpoints and goals. Negotiation processes can be applied
at three distinct levels – action trading (a kind of barter), belief
exchange and goal exchange. In the current version (1) three simple
negotiation protocols have been implemented along with example
viewpoints – for illustrative purposes.
14.1.2 Original
Purpose of Model
The purpose of constructing the model was to
solidify some of the on-going theoretical discussions at previous FIRMA
workshop meetings in Clermont-Ferrand, Oxford and Maastricht concerning
the possibility of a “generic negotiation model” that could be tailored
with minimal programming effort to specific partner areas. Consequently,
the current model separates the agent “viewpoints” from the code by
providing a simple “viewpoint description language” allowing for agent
viewpoints to be described in a high-level and intuitive way.
The main purpose of version 1 was to demonstrate
that such a generic model was possible and could be used by the FIRMA
partners in collaboration with the Centre for Policy Modelling (CPM) for
application to specific regional variations. This aim was achieved, and
the CPM is currently working with the Maastricht group to tailor the
model to that region’s requirements. Specifically, to implement (at the
viewpoint level of detail) the negotiation processes studied in detail
by the Maastricht team involves government, citizen groups and gravel
extractors. The Maastricht team have already produced a simulation
model at the level of preferences to describe the process. A properly
extended Neg-o-Net should allow for the explicit representation of the
beliefs of agents and the dynamic negotiation process. This would allow
the preferences to be “unpacked” into the underlying beliefs. For
example, agents will be able to give reasons for disagreeing
with proposed government plans and the government agent will attempt to
reformulate plans to take account of this. These processes will be
given as a natural-like language trace that should be understandable to
anyone familiar with the domain.
Additionally, the model is to be integrated into
the online Zurich Water Game (Gilbert et al 2001). Here, the agents will
interact with people playing the game. Currently, the artificial agents
in the game have fixed viewpoints, strategies and negotiation protocols
but utilising the flexibility of the Neg-o-Net model should allow for
these to be easily changed. This could offer future potential for
knowledge elicitation – by allowing real stakeholders to negotiate with
artificial agents and comment on their deficiencies as a realistic
representation.
14.1.3 How
was the Model Actually Used
The model has currently been used for
demonstration purposes to the regional applications teams. Currently the
CPM is working intensively with the Maastricht team to specialise the
next version of Neg-o-Net to the negotiation processes identified in
that region.
14.1.4 How
the model relates to FIRMA’s aims and objectives
The model allows the explicit representation of a
negotiation between parties with given their different views as to what
is possible in the world with respect to the relevant domain. It is specifically designed to facilitate its
integration into models which combine other relevant aspects of the
situation in each of the five regions. It
is also designed with a view to the participatory elicitation of
representations of the parties different views in terms of simple
diagrams. Thus it forms a key part of
analysing those hydrosocial issues of water management that include
negotiated elements. It is the key core
element that will enable the development of a somewhat generic model
design, but one which is deeply relevant to the regions separate
problems. Finally it is designed to
facilitate the participatory integrated assessment in the five regions.
14.1.5 Relationship
to other Models
The Neg-o-Net model was inspired by the Part-Net
model (Conte & Pedone 1998) which in-turn was an extension of the
Dep-Net model (Conte & Sichman 1995).
Part-Net and Dep-Net were produced by the IP-CNR Rome modelling group
and the SimCog group São Paulo. Neg-o-net was designed in consultation
with the Rome group and is consistent with their developments in the
area of social norm dynamics. A subset of goal level negotiation may be
viewed as the spread of normative beliefs. This could be seen as the
“top-level” stopping condition in the three levels of negotiation
previously outlined. Specifically, if an agent wishes to convince
another to adopt a high-level goal (for example “increase the quality of
life of the citizens”) for which it has no justifying higher-level goal
then these may be considered as a form of institutional norm. In this
context, theories of norm adoption would be applicable and capable of
being integrated into the Neg-o-Net model should this be required
(Pedone 2000).
Additionally Neg-o-Net leaves space for the
integration of an environmental model (which would be produced by the
regional application teams). In order to drive a simulated negotiation
run (where actions are taken with environmental consequences and the
results observed and reacted to) an environmental model is required.
Future work may integrate the already developed Maastricht environmental
model into the Neg-o-Net framework. At the end of a negotiation process
agents submit the agreed actions to the environmental model, which then
returns the environmental consequences of those actions.
14.2.1 Intended
interpretation
The model is descriptive. This means the
interpretation is that of a dynamic description of the kinds of
negotiation process that occur for given regional applications. The
current non-specialised demonstration versions (1) gives an example of
the kind of negotiation process descriptions that can be captured – but
is not linked to any specific regional application. In this sense (as
stated previously) version 1 of the model is a demonstrator and is
currently being applied to regional applications.
The target phenomena are that of a multi-agency
(stakeholder) negotiation dialogue and subsequent plans of action.
Agents communicate in natural-like language their requests, proposals
and suggestions, come to agreements and then take action. Each of these
should correspond directly to real world stakeholder consultations and
action plans at the descriptive level. Each agent has a viewpoint
representing beliefs, goals and possible actions. These viewpoints
should coincide with real stakeholder viewpoints at the given level of
detail.
The aim of the model is not to be
predictive in any narrow sense. We aim to produce traces of plausible
and possible negotiation dialogues and action plans. The validation
of the plausibility of the output should ultimately be directly from
stakeholders with minimal mediation provided by modellers.
A well validated Neg-o-Net model applied to a
regional application would offer some kinds of wider predictive
utility. It may be possible to show that for given environmental
assumptions, viewpoints and negotiation protocols, certain kinds of plan
are never possible or unlikely. It might also be possible to
show that certain disagreements are inevitable or likely. Given
this, the ultimate aim of such modelling would be to computationally
evaluate new negotiation protocols computationally and select or
propose those which appear to increase the likelihood of desirable
outcomes (policy advice) – though this is still a distant aim at
present and beyond the scope of the current project.
14.2.2 Original
Sources for Model Design
The general approach was inspired by the previous
models Dep-Net (Conte & Sichman 1995) and Part-Net (Conte &
Pedone 1998), although the emphasis is different from those models. The
initial design process was carried out intensively with the IP-CNR Rome
group. The Part-Net framework was extended to incorporate a three
layered negotiation process and a digraph causal action/state viewpoint
belief representation. In this scheme each agent stores their own
viewpoint digraph based on their beliefs about states and actions. Arcs
represent transitions between states (nodes). Each arc is labelled with
some set of “actions” which are believed to produce movement between
each node. Each node stores a world state description (including some
set of environmental indicators) and some set of possible actions
available to the agent holding the given viewpoint. Nodes are ordered by
agents based on some desirability function – some weighted sum over
state indicator values attached to each node.
14.2.3 Static
Structure
In the current version (1) of the model the
viewpoint digraphs stored by each agent do not change (in later
versions, when belief and goal exchange is implemented, these structures
will become dynamic). Figure 48
shows three example (essentially trivial and non-realistic) viewpoint
digraphs. These represent the viewpoints of three agents (a
manufacturing company, a political party and a citizens interest group).
Figure 48. Some illustrative
viewpoints (simplified fragments) for three agents. Note that each node
contains a label, indicator values and a list of possible actions. Arcs
are labelled with (believed) required action(s) to make transition to
new state
In Figure 48,
each agent has a viewpoint with only three nodes – this is a simplified
example. The first text line listed at the top of each node is simply a
label to identify the node – it should sum-up the world state concisely.
The next line of text gives the values of indicators that the given
world state represents. Each remaining line lists a possible action
that the agent holding the given viewpoint believes it can take. Each
arc is labeled with any actions (believed to be) required to move
between states.
Note that for each
agent in Figure48,
is listed a “weighting” of indicator values which defines their
preferences over nodes. So, the company gives the “profit” indicator a
weighting of 1, but the “env” (environmental concern) indicator only 0.5. This is just a short-hand way of capturing the
notion that this particular company prefers profits over environmental
concern but that such issues are not ignored and if significant could
override profit. Obviously, the meaning of such weightings is only
discernable when considered against the values placed on indicators in
nodes of the agent viewpoint digraph. Costs and additional explanatory
comments can be attached to actions and nodes but these are not shown
in the figure.
These static
structures are not hard-coded into the Neg-o-Net code but stored in a
text file (in the form of a kind of high-level language) the text file
input into Neg-o-Net that creates agents with the specified viewpoints. Figure 49
shows a fragment of the input file (the full input file is given in
appendix 1 below).
Figure 49. Example fragment of
input text file to neg-o-net.
14.2.4 Temporal
Structure
In the current version dynamic change occurs in
the believed current world states of each agent and during negotiation
when agreements and offers are made and stored. In the context of Figure 48,
this means that as the model is executed the believed world states
(current node) for each agent changes over time. This change occurs
based on agents attempting to move to “better” nodes – as defined by the
weightings placed on the indicator values.
The process of attempting to move to “better”
nodes often requires agents to look for other agents to perform required
actions (if they do not have the ability to perform the action required
themselves). For this “action haggling” to occur agents enter into a
negotiation process. In the current version only one semi-plausible
negotiation protocol is implemented. The model also implements (for
comparison purposes) agents acting independently in addition to (again
for comparisons purposes) agents acting in perfect unison, exploring
all possible mutual action sets and maximising their joint preferences
(which may or may not be meaningful depending on the scenario).
Consequently there are three distinct ways that the current mode can
interpret the viewpoint input file and produce output.
When agents negotiate they use two kinds of
communication – broadcast (messages sent to all) and one-to-one (one
agent sends another a message – no others can read the message). During
a dialogue agents track and store any agreements made with other agents
(concerning actions to perform). These agreements are then executed when
no more negotiation is possible.
14.2.5 Important
Parameters
As stated above, all the major parameters are
stored in the viewpoint input file (see Figure 49).
This includes, the number of agents, the viewpoints of each agent, the
action repertoires at each believed world state, the indicator values
and weightings and possibly action costs. Collectively this information
defines the agent side (subjective side) of a “scenario”. The other
important aspect of the scenario is the incorporation of an
environmental simulation (produced elsewhere).
14.2.6 Initialisation
As stated above, the model is initialised via the
viewpoint file (see Figure 49).
Currently the negotiation protocols are hardwired but in future
implementations these could possibly be placed into the file too.
14.2.7 Key
Algorithms
The currently implemented negotiation protocol
follows a process of repeated dyadic agreements concerning actions to
perform. Essentially, agents broadcast to all other agents a list of
requirements (actions that they want to be performed but which they
themselves can not perform alone) and a list of possible offers (actions
they are able to perform). The offers are broadcast one-by-one
throughout the negotiation rather than in one block at the start. The
idea here is that agents are happy for others to know what they want,
but would rather not let all agents know what they could supply until
this is required to make a deal. This way, the least costly actions can
be offered first.
If an agent sees an offer that satisfies one of
its requirements then it directly communicates with the offering agent.
If the offering agent still has outstanding requirements it will ask for
a deal based on this. If an agreement is made between two agents to
perform certain actions, this is broadcast to all other agents. In this
way all deals are transparent (there are no secret deals). Agreements,
once made, are always honoured. Agents stop negotiating when they can no
longer satisfy any more requirements. When all agents have stopped,
agreed actions are performed.
Essentially then, agents simply form paired
(dyadic) agreements to perform actions that are mutually beneficial.
Agents only agree to perform actions that they believe will take them to
a better node (based on their viewpoints, the actions they have decided
to take and any announced agreements).
Note, as stated previously, this negotiation
protocol was implemented purely as a “first example” of the kinds of
possible protocols (or strategies) that could be implemented based on
feedback from regional application partners.
14.2.8 Description
of Model Dynamics
The dialogue consists of requests, offers and
acceptances of action by the various parties. The
dialogue represents a collective progressive exploration of the
parties’ belief nets for possible ways to improve their indicators
(which represent their goals). Each time a
particular possible pathway is blocked others are tried. The
process stops whenever a set of actions is agreed. These
actions then change the situation and the negotiation may begin again.
14.2.9 Implementation
details necessary to get the simulation to run but not considered
important for the results
There is little that is ‘extra’ in this model,
since it is fairly simple. However it is
likely that the exact order and extent in which agents consider their
own belief nets will not always be significant to the results, but this
needs to be confirmed with respect to the chosen object domains.
14.2.10 Implementation
Language
The model is implemented in Sun Java2 JDK1.3.1.
All necessary libraries are packaged into the JAR file. Additionally the
model has been implemented in SDML. This “duel” implementation approach
allows for flexible experimentation and exploratory investigation
(SDML) and rapid execution, cross-platform compatibility and easy
interfacing with other (e.g. environmental) models (Java).
14.2.11 Source
Code
The executable JAR that also includes the source
codes (plus rudimentary documentation) is available at http://www.davidhales.com/firma/negonet.
14.3.1 Example
Simulation Output
Figure 50-Figure 52
below show some of the actual output produced during a negotiation
process based on the viewpoints shown in Figure 48.
Iterations are produced of perception (agents locate their current
node), negotiation (make offers, post
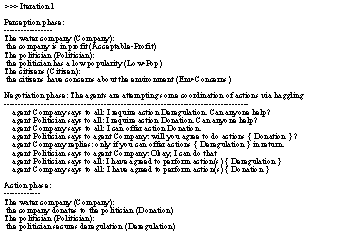
Figure 50. Example output from
Neg-o-net model (I)
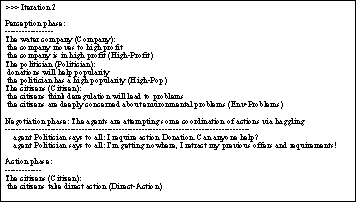
Figure 51.
Example output from Neg-o-net model (Ii)
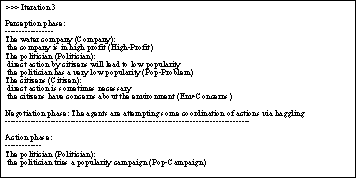
Figure 52. Example output from
Neg-o-net model (Iii)
requirements and form agreements) and actions
(agents perform agreed actions). Note, for the given viewpoints and
implemented negotiation protocol, this output is not meant to represent
any actual real negotiation process but is given as an example of the
kind of process that can be captured by the model.
14.3.2 Results
claimed as significant
The significant result obtained from Neg-o-Net
version 1, is illustrated by the textual negotiation trace (see Figure 50
to Figure 52)
and its relationship with the viewpoint representation. From a fairly
loose and intuitive viewpoint representation (see Figure
48)
multiple agents can negotiate at the level of actions in a way that is
understandable to those with knowledge of the domain. As stated
previously, the model is a point of departure for producing more
specialised and realistic neg-o-net versions that suit different
regional applications.
14.3.3 Methodological
Lessons
This initial version of neg-o-net was produced to
solidify discussions concerning the possibility of a generic negotiation
framework from which regional applications could be derived. In this
sense it is part of the first iteration, whereby the model is presented
to the regional groups with domain expertise for their area and then
modifications are made. At this stage, this method of development
appears to be productive. However, in order to produce suitably
specialised models, several iterations will be required requiring close
liaison with the regional partners.
14.3.4 Future
Development
As stated in previous sections the next version of
the model is being developed for the Maastricht regional application.
This will involve a “government agent” which produces plans, and a set
of stakeholder agents that comment on those plans. The government agent
modifies the plans based on the stakeholder response – effectively
incorporating stakeholder beliefs into its
own viewpoint. Here then, a kind of “second order” knowledge will be
stored by the government agent – knowledge about others beliefs. The
negotiation process will involve iterations of government plans and
stakeholder objections or suggestions, terminated when no further change
is possible or when some maximum number of iterations has been
executed. Additionally, viewpoints will be broken-up into a number of
independent and concurrent digraphs that relate to specific issues (e.g.
risk of flooding, cost to consumer, environmental impact etc.). It has
been evident that a single digraph is not a sufficiently compact
representation when there are several issues that need to be considered
simultaneously. The graphs become horrendously large due to the
combinatorial explosion for considering each possible world state and
action.
14.3.5 Published
works relevant to the model
For a rough lineage leading to Neg-o-Net version 1
see Dep-Net (Conte & Sichman 1995) then Part-Net (Conte & Pedone
1998). However, these models have different aims. For a previous
negotiation model applied to the same context but with a different
approach see Moss (2002).
Conte, R. & Sichman, J. (1995), DEPNET: How to
benefit from social dependence, Journal of Mathematical Sociology,
1995, 20(2-3), 161-177.
Conte, R. and Pedone R. (1998), Finding the
best partner: The PART-NET system, MultiAgent Systems and
Agent-Based Simulation, Proceedings of MABS98, Gilbert N., Sichman J.S.
and Conte R. editors, LNAI1534, Springer Verlag, pages 156-168.
Moss, S. (2002), Challenges in agent based
social simulation of multilateral negotiation, Socially Intelligent
Agents: Creating Relationships with Computers and Robots, Kluwer, pages
251-258.
Gilbert et al (2001), Computer Simulation and
Participatory Research, Talk Presented at the SIMSOC-V workshop,
September 2001, available at: http://www.soc.surrey.ac.uk/simsoc5/talks-page/talk05.htm.
Pedone et al (2000), Social
& Institutional Influence - Why people accept policies.
Available at: http://firma.cfpm.org/partners/internal-reports.html
The full listing (actual input file to neg-o-net)
capturing the example shown in figure 1 of which Figure
53
shows the first few lines.
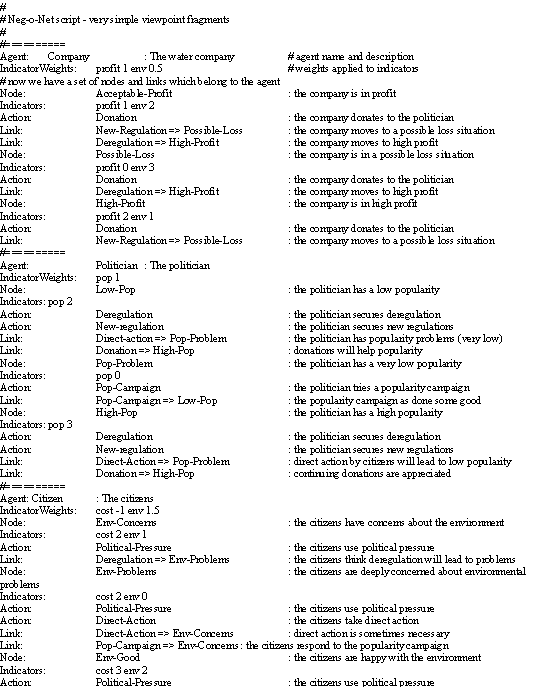
Figure 53. Example Neg-o-net
output
After discussions with the Maastricht group
concerning their case study, it was decided to add a new negotiation
protocol to negonet. This would more closely reflect the actual process
studied by the group. A form of “Policy agent mediated” negotiation was
implemented in which stakeholder agents make proposals to a Policy
agent. The agent assesses these and proposes plans back.
The Policy agent
has preference weights over the other agents. It proposes plans to the
agents to maximize preferences. Agents respond indicating their own
satisfaction levels based on their preferences and any actions that they
can perform. The Policy agent then extends / updates its viewpoint to
include these – i.e. it learns. So the Policy agent can start with an
empty viewpoint and induce one from dialogues with agents. Figure 1
shows a schematic of the communication structure in Negonet version 1
and Figure 2 shows the contrasting structure for Negonet version 2.
Figure 3 shows example output from the first iteration of negotiation
with Negonet version 2 with the same input script as given previously.
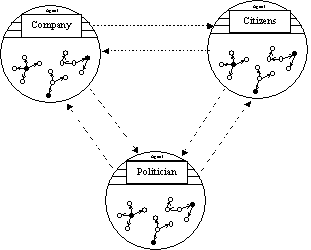
Figure 54.
Negonet version 1, negotiation structure
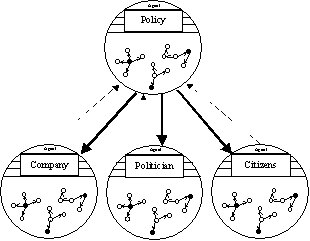
Figure 55.
Negonet version 2, negotiation structure
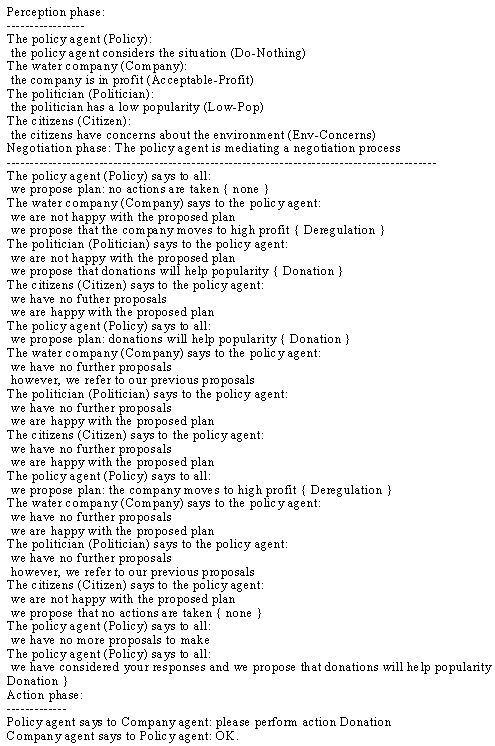
Figure 56.
Example output from negonet version 2
R. Conte, R.Pedone, ISTC-CNR (IP-CNR)
The ISTC group aimed to provide (a) an ontology
(norms, negotiation, etc.), (b) a taxonomy (institution,
side-institution, etc.), and (c) abstract multi-agent models, which are
essential conditions for the achievement of the FIRMA last three aims,
with special reference to
· the
negotiated design of policies, and
· the
diffusion of such innovation (“innofusion”), by means of agent-based
simulation.
In this sense, it provides a baseline that can be
instantiated to specific environmental and social problems and policies,
and to a variety of social and institutional scenarios.
The PArt-Net Dynamics Of Regulation among limited
autonomous Agents (PANDORA) is an extension of PART-NET, an agent-based
computational model developed for the formal investigation of
partnerships formation, to modelling norm-based dynamics among
autonomous social agents, consisting of two main sub-processes: the
negotiation-based issuing of new policies, and their adoption and
execution on the part of autonomous social agents.
The current extension of the model is intended to
formally describe the social and cognitive processes and mechanisms
characterising the dynamics of norm issuing, adoption and dissemination
among intelligent interacting agents at different levels of complexity,
i.e., macro-agents and micro-agents. The former (institutions and
organisations) are involved in the negotiation process for the issuing
of new norms, which influence individual agents through their mental
states. At the current stage, the model is designed at the abstract
level. No direct application to real case study has been made. The
Part-Net Negotiation Model was developed by ISTC-CNR (IP-CNR).
15.3.1 Description
Domain Context
The model is a general framework for formalising
and possibly simulating the introduction of new policies and their
dissemination in a population of autonomous agents. Each agent
represents an autonomous, heterogeneous and versatile entity: it is
endowed with cognitive machinery for the regulation of its behaviour. In
a social environment (shared at least by two agents), a number of
different and important issues are addressed by means of agent
interactions, namely communication, adoption and negotiation.
15.3.1.1 Communication
Interaction among agents is often realised by
means of communication. A simple form of communication is emission of
simple signals with fixed interpretations. A more complex form of
communication is the ‘message passing’ performed at least at two levels:
one corresponding to the informational content of the message and the
other corresponding to the intention of the communicated message. When
the interaction among agents is performed by means of message passing,
each agent ‘must be able’ to infer the intention of the sender
regarding the sent message (e.g. KQML; KIF).
15.3.1.2 Adoption
By definition, agents are autonomous, but not
self-sufficient. The PART-NET model enabled the description of
interdependencies among agents and the formation of partnerships based
upon them. However, the process leading agents to decide whether to
accept and adopt others’ requests, in order to have one’s own accepted
and adopted in return, was not addressed. The PANDORA extension is
intended to describe the general ingredients and mechanisms of
goal-adoption, as a fundamental process expanding agents’ activity.
Furthermore, such expansion is crucial for describing regulatory
interactions among agents, allowing for the model to be applied to the
context of policy-making and evaluation.
Adoption implies considering the requests of other
agents in the same environment when planning and executing one’s own
actions, whether such requests are made by macro- or micro-agents. This
involved two decisions that are taken by the recipient: to recognise
something (a message) as a request, and to adopt it, i.e. to transform
it into one’s goal, and possibly satisfy it. The first decision, which
is called acceptance, is probably more intuitive in the context of
normative requests: agents must recognise an object (a message) as a
normative request in order to adopt it.
15.3.1.3 Negotiation
In our view, negotiation is a process of bilateral
adoption: agents negotiate when each wants the other to adopt all or
part of its goal(s). The process of negotiation implies that one or more
of the agents involved makes a given request (candidating a norm). This
is either agreed upon by the counterpart and finalised as such, or is
modified through a recursive process of feedback and re-candidacy among
the partners until either agreement is reached or negotiation fails.
The goal(s) finally adopted may be more or less far from the initial
candidates, and the level of respective satisfaction varies as a
function of this.
The social entities considered are at different
levels of complexity: macro-agents include institutions and
organisations (e.g. private companies), micro-agents are individual
citizens. But the typology may also include meso-formations, federation
community, groups creation associated with a single “facilitator” to
which agents surrender a degree of autonomy (NGO, unions, parties, etc.).
15.3.2 Original
Purpose of Model
The PART-NET model aimed to
· describe the dependence
relationships among agents
· autonomous
· heterogeneous agents
· different social level
(Institutions / Citizens)
· endowed with different actions,
goals, beliefs and obligations and strategies
· calculate the formation of
partnerships among them.
The
PANDORA model is instead aimed to provide a theory-driven instrument for
the description and simulation of regulatory interactions, and more
specifically, to
· Describe
the negotiation process among different entities (e.g., institutions
and organisations) leading to a given measure
of policy to be issued.
· Predict its impact under different
mechanisms of norm adoption, i.e.:
· incentive-based or sanction-based
· social control-based (intra-group
sanctions via reputation)
· social learning-based (what
is now called “biased” transmission (Heinrich, 2000), i.e. selective
monitoring and imitation.
The rationale of this model draws upon current
studies of cultural transmission and diffusion of innovation (Heinrich
and Boyd, 2000; Heinrich, 2000; Bowles, 1998). According to these
studies, the typical pattern of results found in empirical studies of
the dissemination of innovations is better reproduced by simulations of “biased” transmission models, where agents
apply social and cognitive strategies as exemplified above, than by
“environmental learning” models. By “environmental learning” we mean the
import and reproduction of innovations which are expected to maximize
the performer’s fitness or utility. To ensure that the model has a
capability of predicting the impact of policies, sufficiently realistic
strategies of dissemination need to be implemented.
15.3.3 How
was the Model Actually Used
PART-NET and the main components of the PANDORA
extension have been adopted for the initial design of the Neg-o-Net
model developed by the Centre for Policy Modelling at Manchester
Metropolitan University, in collaboration with our group.
15.3.4 Relationship
to other Models
PANDORA represents a natural extension of the
Part-Net model (Conte & Pedone, 1998) which, in turn, is a
derivation of the DEP-NET model (Conte & Sichman, 1995). DEP-NET and
PART-NET were produced by the ISTC-CNR (once, IP-CNR) group and the
SimCog group of S. Paulo, Brazil. At the current stage of its
development, PANDORA has inspired the development of the Neg-o-Net model
by the CPM-MMU group.
15.4.1 Intended
interpretation
Both PART-NET and PANDORA are to be interpreted as
theory-driven formal-computational tools for the description of
interactions among limited autonomous agents in a common environment. The models are currently specified at a rather
abstract level, in order to be implemented in a wide range of situations
and for a variety of applications.
The target phenomenon is innovation in
policy-making, and more specifically, the dynamic, participatory or
negotiation-based issuing of designed policies, their impact on
autonomous agents, and their dissemination.
Each agent is defined by a set of beliefs, goals,
actions and strategies that represents the stakeholder viewpoint and
intention. Both the negotiation and the adoption process are designed in
terms of a general mechanism for generating new mental states (namely,
beliefs and goals), starting from the interaction among current inputs
and existing ones. Norms (or policies) are treated as “artefacts”
produced by negotiating social entities which are processed and
possibly adopted by their addressees and get disseminated in the
population as an effect of different strategies, drawing upon the
“biased transmission” model.
15.4.2 Original
Sources for Model Design
PANDORA is an agent-based computational model
developed for the formal investigation of processes of negotiations
involved in partnerships formation. As mentioned earlier the Part-Net
Negotiation model represents an extension of the Part-Net model (Conte
& Pedone, 1998) which is a derivation of the Dep-Net model (Conte
& Sichman, 1995). Dep-Net and Part-Net were produced by ISTC-CNR
(ex. IP-CNR) Rome modelling group and the SimCog group S. Paulo.
15.4.3 Static
and Temporal (dynamic) Structures
PANDORA is an abstract model. Each agent
represented in it is defined by a set of characteristic structures like
beliefs, goals, actions, strategies, trust and reputation. These
structures are static in the sense that they are both present in all the
agents. Moreover, they are dynamic regarding the agent’s ability to
change contents or values and generate or delete them.
Real static structures are the basic mechanisms of
norm adoption and strategies of implementation (see Appendix).
15.4.4 Important
Parameters
The important parameters of the model are: number
of agents, and the agent’s characteristics: number/content/type/value of
beliefs, goal, actions, strategies, etc.
15.4.5 Initialisation
A possible model implementation via simulation
could be initialised to represent different social/cognitive scenarios.
15.4.6 Key
Algorithms
An important algorithm is one that defines the
norm negotiation process. Negotiation is defined as a bilateral norms
adoption: agents negotiate when each wants the other to adopt all or
part of its goal(s). The process of negotiation implies, as an example,
that one of the agents makes a given request of another agent. In
principle, this is either agreed upon by the counterpart and finalised
as such, or is modified through a recursive process of feedback and
re-candidacy among the partners until either agreement is reached or
negotiation fails. At the current stage the negotiation algorithm is
under development.
15.4.7 Description
of Model Dynamics
In addition to the dynamics characterizing
PART-NET, the PANDORA model dynamics will be strictly related to a
working definition of the negotiation algorithm described above.
15.4.8 Implementation
Language
The model is not currently implemented. The
implementation language could be any programming languages such as C or
Java.
15.4.9 Source
Code
The source code is a pseudo-code very close to an
object programming language.
15.5.1 Results
claimed as significant (and Methodological Lessons)
These include
· a
preliminary ontology of social entities and objects involved in policy
innovation:
· Institution,
an agent endowed with goals, beliefs and actions characterised by
· tutorial
goals over a given population, where a tutorial goal is defined as the
goal to influence another agent or set of agents to acknowledge and
promote their interest (and interest being what increases the
achievement of one’s goals)
· adoption
and negotiation mechanisms
· the
“capacity” (action) to candidate policies, or norms, where a norm is an
external “artefact” in the form of a prescription (an obligation to
accomplish an action on a set of agents) that, to take effect, must be
adopted by the addressees.
· Sub-institution,
hierarchically subordinate, which receives input from the previous one,
and participates in the negotiation process, by providing feedback on
candidate norms.
· Side-institutions,
non-subordinate, characterised by tutorial goals of control over
innovation against some specified finality (e.g., sustainable
development)
· Endowed
with the same properties as above
· participating
in the negotiation process.
· Extension
of the general theory of adoption to modelling negotiation
· Integration
of the “biased transmission” model in an agent-based framework.
· A
model for describing adoption, dissemination and innovation of norms.
15.5.2 Future
Development
These include
· The
construction of an algorithm for the implementation of PANDORA and for
running simulations of both real situations and for obtaining
experimental results about
· The
impact of specified policies
· The
respective effects of strategies of adoption
· The
interplay between negotiation and impact
· The
effect of different strategies of adoption on dissemination.
· The
validation of the adoption and negotiation model
Refinement of the current ontology.
15.5.3 Published
works relevant to the model
Bowles, S.1998
Cultural Group Selection and Human Social Structure: The effects of
segmentation, egalitarianism, and conformism. Electronic document. http://www-unix.oit.umass.edu/~bowles/papers/cultural.PDF
Conte et al (2000), Social &
Institutional Influence - Why people accept policies. Available at: http://firma.cfpm.org/partners/internal-reports.html
Conte, R. & Sichman, J. (1995), DEPNET: How to
benefit from social dependence, Journal of Mathematical
Sociology, 1995, 20(2-3), 161-177.
Conte, R. and Pedone R. (1998), Finding
the best partner: The PART-NET system, MultiAgent Systems and
Agent-Based Simulation, Proceedings of MABS98, Gilbert N., Sichman J.S.
and Conte R. editors, LNAI1534, Springer Verlag, pages 156-168.
Heibrich, J.
(2000) Cultural Transmission and the Diffusion of Innovation, http://webuser.bus.umich.edu/henrich/diff2.pdf
Heinrich, J, and
Boyd, R. (2000) The Evolution of Conformist Transmission and the
Emergence of between-group differences, Evolution of Human
Behaviour, 19: 215-242.
Pedone, R. & Conte, R. (2000) The Simmel
Effect: Imitation and Avoidance in Social Hierarchies. In S. Moss &
P. Davidsson (Eds). Multi-agent based simulation,
Springer, 2000.
Pedone, R., Conte, R., (2001) Dynamics of Status Symbols and
Social Complexity, Social Science Computer Review, Vol.
19, No. 3, Fall 2001, 249-262.
Pedone, R., Parisi, D., (1997), In what kinds of social
groups can “altruistic” behaviors evolve?, Simulating Social Phenomena,
R. Conte, R. Hegselmann, and P. Terna (Eds), Lecture Notes
in Economics and Mathematical Sistems 456. Springer-Verlag Berlin
Heidelberg. 1997.
15.6.1 (some)
Basic structures of the PANDORA model
|
AGENT
STRUCTURE
|
|
Agent
|
#
[numeric id]
|
[number]
|
|
Life
|
ALIVE/DEAD
|
[boolean]
|
|
Type
|
INSTITUTION
/ CITIZEN [GO, NGO, etc.]
|
[string]
|
|
Name
|
Agent Name
|
[string]
|
|
SECTION
DEPENDENCE/KNOWLEDGE NETWORK
|
|
Net(n).
|
Network size
|
number
|
|
With
(agent) “X”
|
Agent
ID
|
number
|
|
Type
|
UNI /
BI-LATERAL
|
boolean
|
|
Link
|
ACTIVE /
NOTACTIVE
|
boolean
|
|
SECTION
REPUTATION
|
|
reputation.public
|
#
[numeric value]
|
number
|
|
reputation.self
|
#
[numeric value]
|
number
|
|
SECTION
TRUST
|
|
trust.public
|
#
[numeric value]
|
number
|
|
trust.self
|
#
[numeric value]
|
number
|
|
SECTION
GOALS
|
|
goal
|
#
[numeric ID]
|
number
|
|
content
|
Goal
content description
|
string
|
|
name
|
Goal name
|
string
|
|
active
|
YES/NO
|
boolean
|
|
public
|
YES/NO
|
boolean
|
|
state
|
SATISFIED /
UNSATISFIED
|
boolean
|
|
source
|
BUILTIN-INNATED
/ GENERATED ADOPTED / PLANNED / OBLIGATORY
|
string
|
|
value
|
Goal value
|
number
|
|
priority
|
LOW/MEDIUM/HIGH
|
string
|
|
SUB SECTION
|
GOAL
DEPENDANCIES
|
|
|
dep_on_Ag
|
Dep. on Ag #
[numeric id]
|
number
|
|
obj_id
|
Dep of obj #
[numeric id]
|
number
|
|
obj_class
|
[redundant]
GOAL, ACTION, BELIEF, ETC.
|
obj
|
|
SECTION
ACTIONS
|
|
action
|
#
[numeric ID]
|
number
|
|
content
|
body of
action / content description
|
string
|
|
effect
|
instored state of the world: OBLIGATORY/NOT_OBLIGATORY
|
string
|
|
name
|
Action Name
|
string
|
|
public
|
YES/NO
|
boolean
|
|
availability
|
REUSABLE/NOTREUSABLE
|
boolean
|
|
source
|
BUILTIN-INNATED
/ GENERATED ADOPTED / PLANNED / OBLIGATORY
|
string
|
|
state
|
PERFORMED/NOTPERFORMED
|
boolean
|
|
cost
|
Action
cost/value
|
number
|
|
priority
|
LOW/MEDIUM/HIGH
|
string
|
|
SUB SECTION
|
ACTION
DEPENDANCIES
|
|
|
dep_on_Ag
|
Dep. on Ag #
[numeric id]
|
number
|
|
obj_id
|
Dep of obj #
[numeric id]
|
number
|
|
obj_class
|
[redundant]
GOAL, ACTION, BELIEF, ETC.
|
string
|
|
SECTION
BELIEFS
|
|
belief
|
#
[numeric ID]
|
number
|
|
content
|
body of
belief / content description
|
string
|
|
name
|
Belief Name
|
string
|
|
public
|
YES/NO
|
boolean
|
|
source
|
BUILTIN-INNATED/ACQUIRED
(Individually or Socially)
|
string
|
|
truthness
|
#
[numeric value]
|
value
|
|
SUB SECTION
|
BELIEFS
DEPENDANCIES
|
|
|
dep_on_Ag
|
Dep. on Ag #
[numeric id]
|
number
|
|
obj_id
|
Dep of obj #
[numeric id]
|
number
|
|
obj_class
|
[redundant]
GOAL, ACTION, BELIEF, ETC.
|
obj
|
|
SECTION
STRATEGIES
|
|
strategy
|
#
[numeric ID]
|
number
|
|
type
|
INCENTIVE
BASED / SOCIAL CONTROL BASED / INST_REPUTATION BASED
|
string
|
|
name
|
Strategy
Name
|
string
|
|
public
|
YES/NO
|
boolean
|
|
SUB SECTION
|
IF_CONDITION_STRAT
|
|
|
str_ifcondition(n).obj_id
|
apply
condition: cond1, cond2, …
|
#[numeric
id]
|
|
str_ifcondition(n).obj_class
|
apply to
obj type: GOALS, ACTIONS, BELIEFS,
|
string
|
|
SUB SECTION
|
IF_CONNECTIVES_STRAT
|
|
|
str_ifconnective(cond1, cond2,...,condn, logial_operator)
|
condition
connections: AND, OR, NOT
|
|
|
SUB SECTION
|
THEN_STRAT
|
|
|
str_then(object,
function,[argument(...)])
|
object id;
funtion(arguments)
object=GOALS,
ACTIONS, BELIEFS
function=new_goal;
new_action; new_belief; change_goal; delete_goal, etc.*
A function can change/delete/generate new
objects (i.e. Goals, Actions, Beliefs)
|
|
|
BASIC MECHANISMS OF NORM
ADOPTION
|
|
INCENTIVE-BASED/SANCTION-BASED
[top-down
control]
|
agents
adopt norms to obtain institutional incentives or avoid institutional
sanctions.
|
|
SOCIAL
CONTROL-BASED
[bottom-up
control]
|
A). agents
control each other’s behavior w.r.t. norms accepted within the group.
B) agents
adopt norms to gain social approval, improve reputation, etc.
|
|
SOCIAL
LEARNING-BASED
[bottom-up
control]
|
agents
conform to the behavior of “significant” others (reputable, powerful,
etc.)
|
|
|
|